
|
Fig. 1
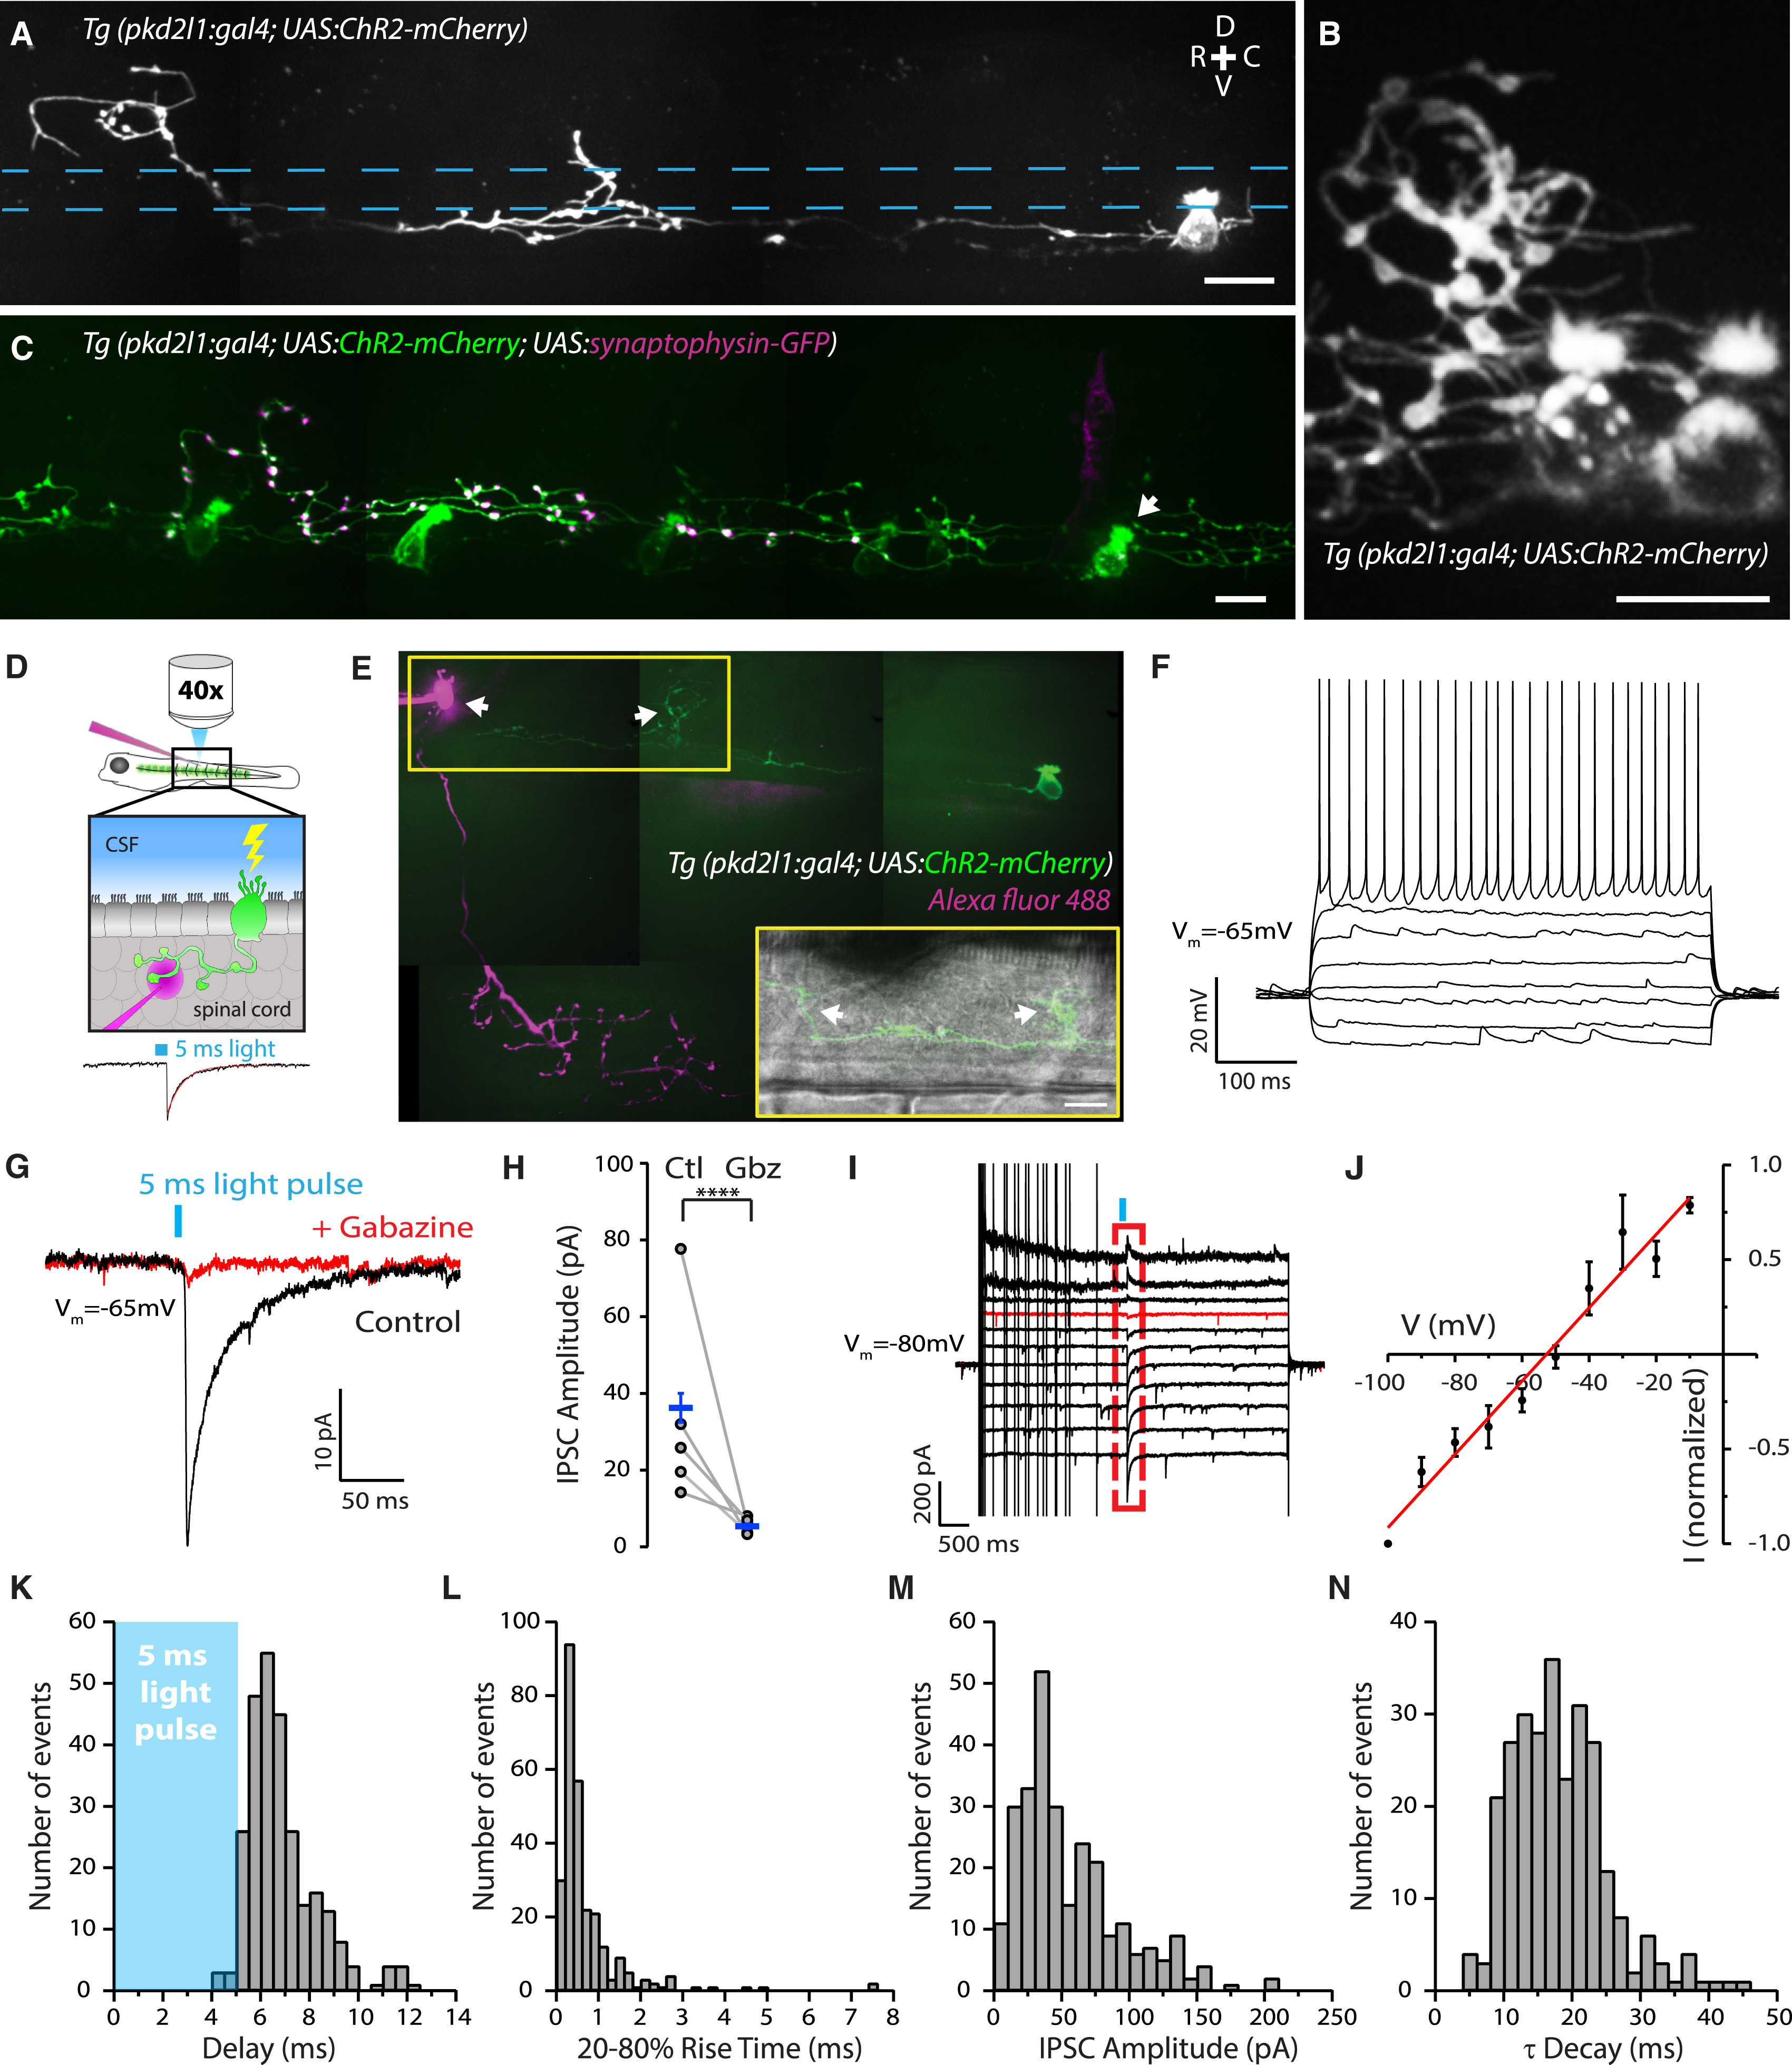
CSF-cNs Specifically Innervate the CaP Motor Neuron
(A) Z projection stack showing a single ventral CSF-cN in a Tg(pkd2l1:gal4; UAS:ChR2-mCherry) double-transgenic larva at 3 days post-fertilization (dpf). Top right: dorsal (D), ventral (V), rostral (R), and caudal (C) orientation indicated by the cross. The central canal location is indicated by blue dashed lines.
(B) CSF-cN axons and varicosities in the 3-dpf Tg(pkd2l1:gal4; UAS:ChR2-mCherry) transgenic larva surround a dorsal cell body.
(C) Labeling of putative presynaptic boutons originating from a single CSF-cN (arrow) expressing synaptophysin-GFP in a 4-dpf Tg(pkd2l1:gal4; UAS:ChR2-mCherry) transgenic larva after injection of the construct UAS:synaptophysin-GFP.
(D) Schematic of the experimental paradigm used for ChR2-mediated mapping of connectivity illustrates a CSF-cN expressing ChR2-mCherry (green) illuminated by a short pulse of light and the whole-cell patch-clamp recording of the target neuron with a pipette containing the Alexa dye to confirm the nature of the cell type (top). A 5-ms light pulse is sufficient to induce a single spike reliably in CSF-cNs (see [5]), and the subsequent IPSC is recorded in the target neuron (bottom).
(E) Z projection stack showing a CaP motor neuron filled with the Alexa dye (magenta) innervated by a single CSF-cN (green) in a 4-dpf Tg(pkd2l1:gal4; UAS:ChR2-mCherry) transgenic larva with sparse expression of ChR2. The boxed region shows a wide-field image with the CaP cell body contacted by the axonal projection of the labeled CSF-cN. Arrows indicate the dorsal projections that surround the soma of the CaP motor neuron recorded and filled as well as another putative CaP motor neuron in the adjacent caudal segment.
(F) Current-clamp recording of a typical CaP motor neuron showing phasic action potential firing in response to current injection (steps of 20 pA from −50 pA to +90 pA).
(G) Voltage-clamp recording from a CaP motor neuron (Vm = −65 mV) showing evoked IPSCs following 5-ms light pulses before (black trace; average of ten trials) and after 10 μM gabazine treatment (red trace; average of ten trials).
(H) Summary data showing that the IPSCs are abolished by gabazine. Each experiment (circle) is the average of ten trials before (Ctl) and after gabazine (Gbz) treatment (mean amplitude of control IPSC, 36.2 ± 24.9 pA; mean amplitude of gabazine IPSC, 5.4 ± 4.1 pA; n = 5, ∗∗∗∗p < 0.0001).
(I and J) Voltage steps and corresponding current-voltage (I-V) curve indicate that the IPSCs (within the red dashed box) reverse at −53 mV (red trace in I) close to the reversal potential of chloride (ECl −51 mV) in our recording conditions (n = 6 cells).
(K–N) Distribution of IPSC delay (K; mean 6.86 ± 0.09 ms), 20%–80% rise time (L; mean 0.89 ± 0.19 ms), current amplitude (M; mean 55.19 ± 2.34 pA, corresponding to a conductance of 3.94 nS), and time decay τ (N; mean 18.04 ± 0.42 ms) (n = 34 cells, 271 trials).
Scale bars, 10 μm. See also Table S1.