
|
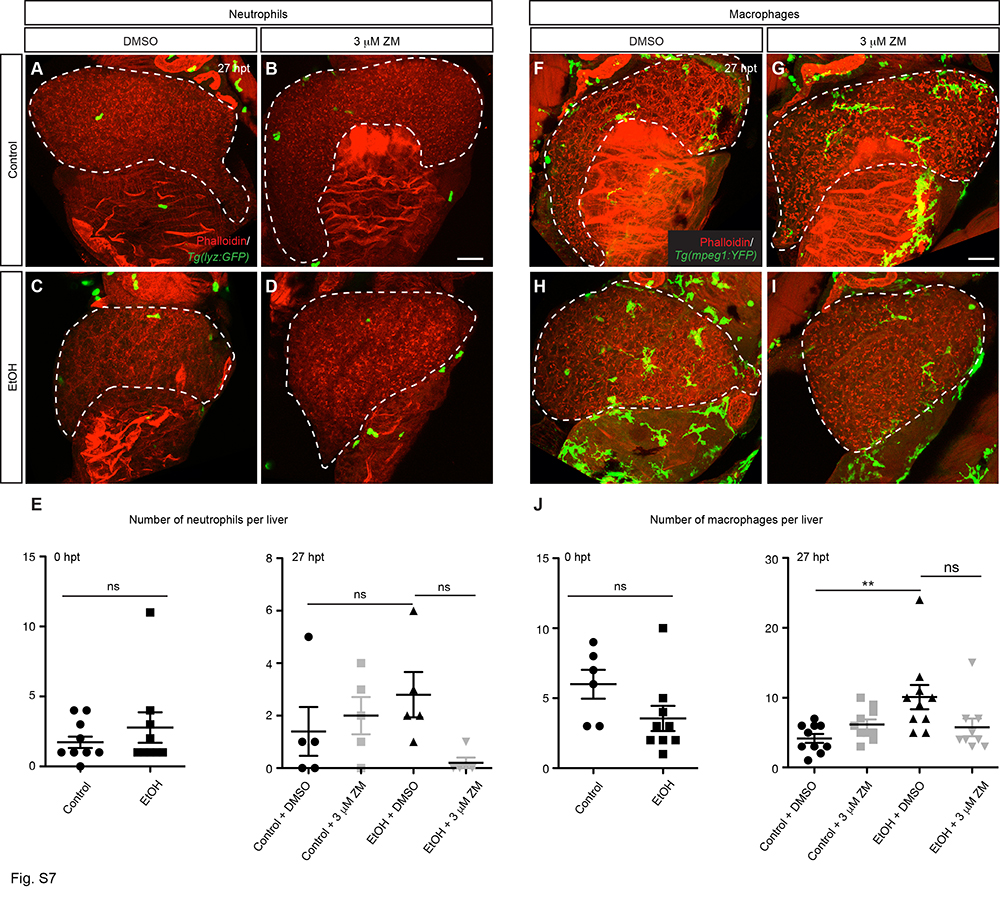
Fig. S7
Few macrophages and neutrophils were recruited to the liver after acute ethanol treatment. (A-D) Confocal three-dimensional projections showing Tg(lyz:GFP)- expressing neutrophils (green) in the whole liver at 27 hpt. (E) Numbers (mean±s.e.m.) of neutrophils per liver at immediately after the ethanol treatment (0 hpt, left) and 27 hpt (right). Only one or two neutrophils were detected in the livers in all experimental groups at both time points. (F-I) Confocal three-dimensional projections showing Tg(mpeg1:YFP)-expressing macrophages (green) in the whole liver at 27 hpt. (J) Numbers (mean±s.e.m.) of macrophages per liver at 0 hpt (left) and 27 hpt (right). (A-D, F-I) Phalloidin staining (red) that labels cell cortex is used for recognizing various organs. Ventral views, anterior is to the top. Dashed line marks the liver. Scale bar, 30 μm. (E, J) Statistical significance was calculated by one-way ANOVA and Tukey’s posthoc test. **, p<0.01, ns, not significant.