
|
Fig. 3
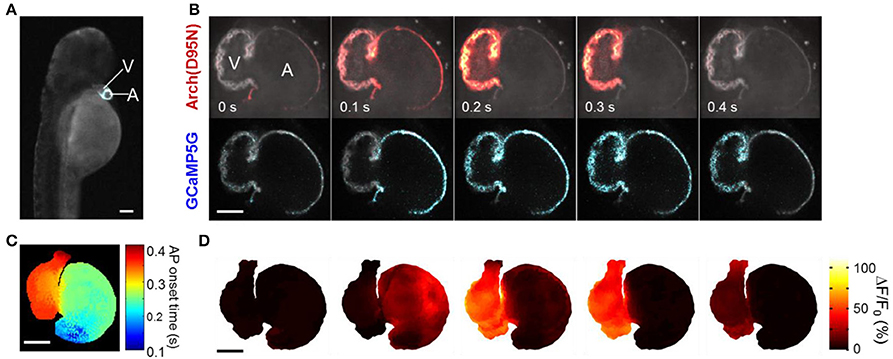
Figure 3. Mapping simultaneous Vm and Ca2+ in the zebrafish heart in vivo. (A) Fluorescence of GCaMP5G in a fish expressing CaViar under the cmlc2 promoter (Supplementary Movie 1). (B) Single optical section of a zebrafish heart expressing CaViar at 4 dpf (Supplementary Movie 2). Cell membranes fluoresced in both the voltage channel (top) and the Ca2+ channel (bottom) as the AP propagated from the atrium to the ventricle. (C) Map of AP isochrones overlaid on a three-dimensional reconstruction of the heart. AP onsets were measured as time to reach 5% of maximum on the rising edge, with sub-frame timing achieved through spline interpolation. (D) Three-dimensional reconstruction of the electrical AP (Supplementary Movie 3). Scale bars in (A–D) 50 μm.