
|
Fig. S7
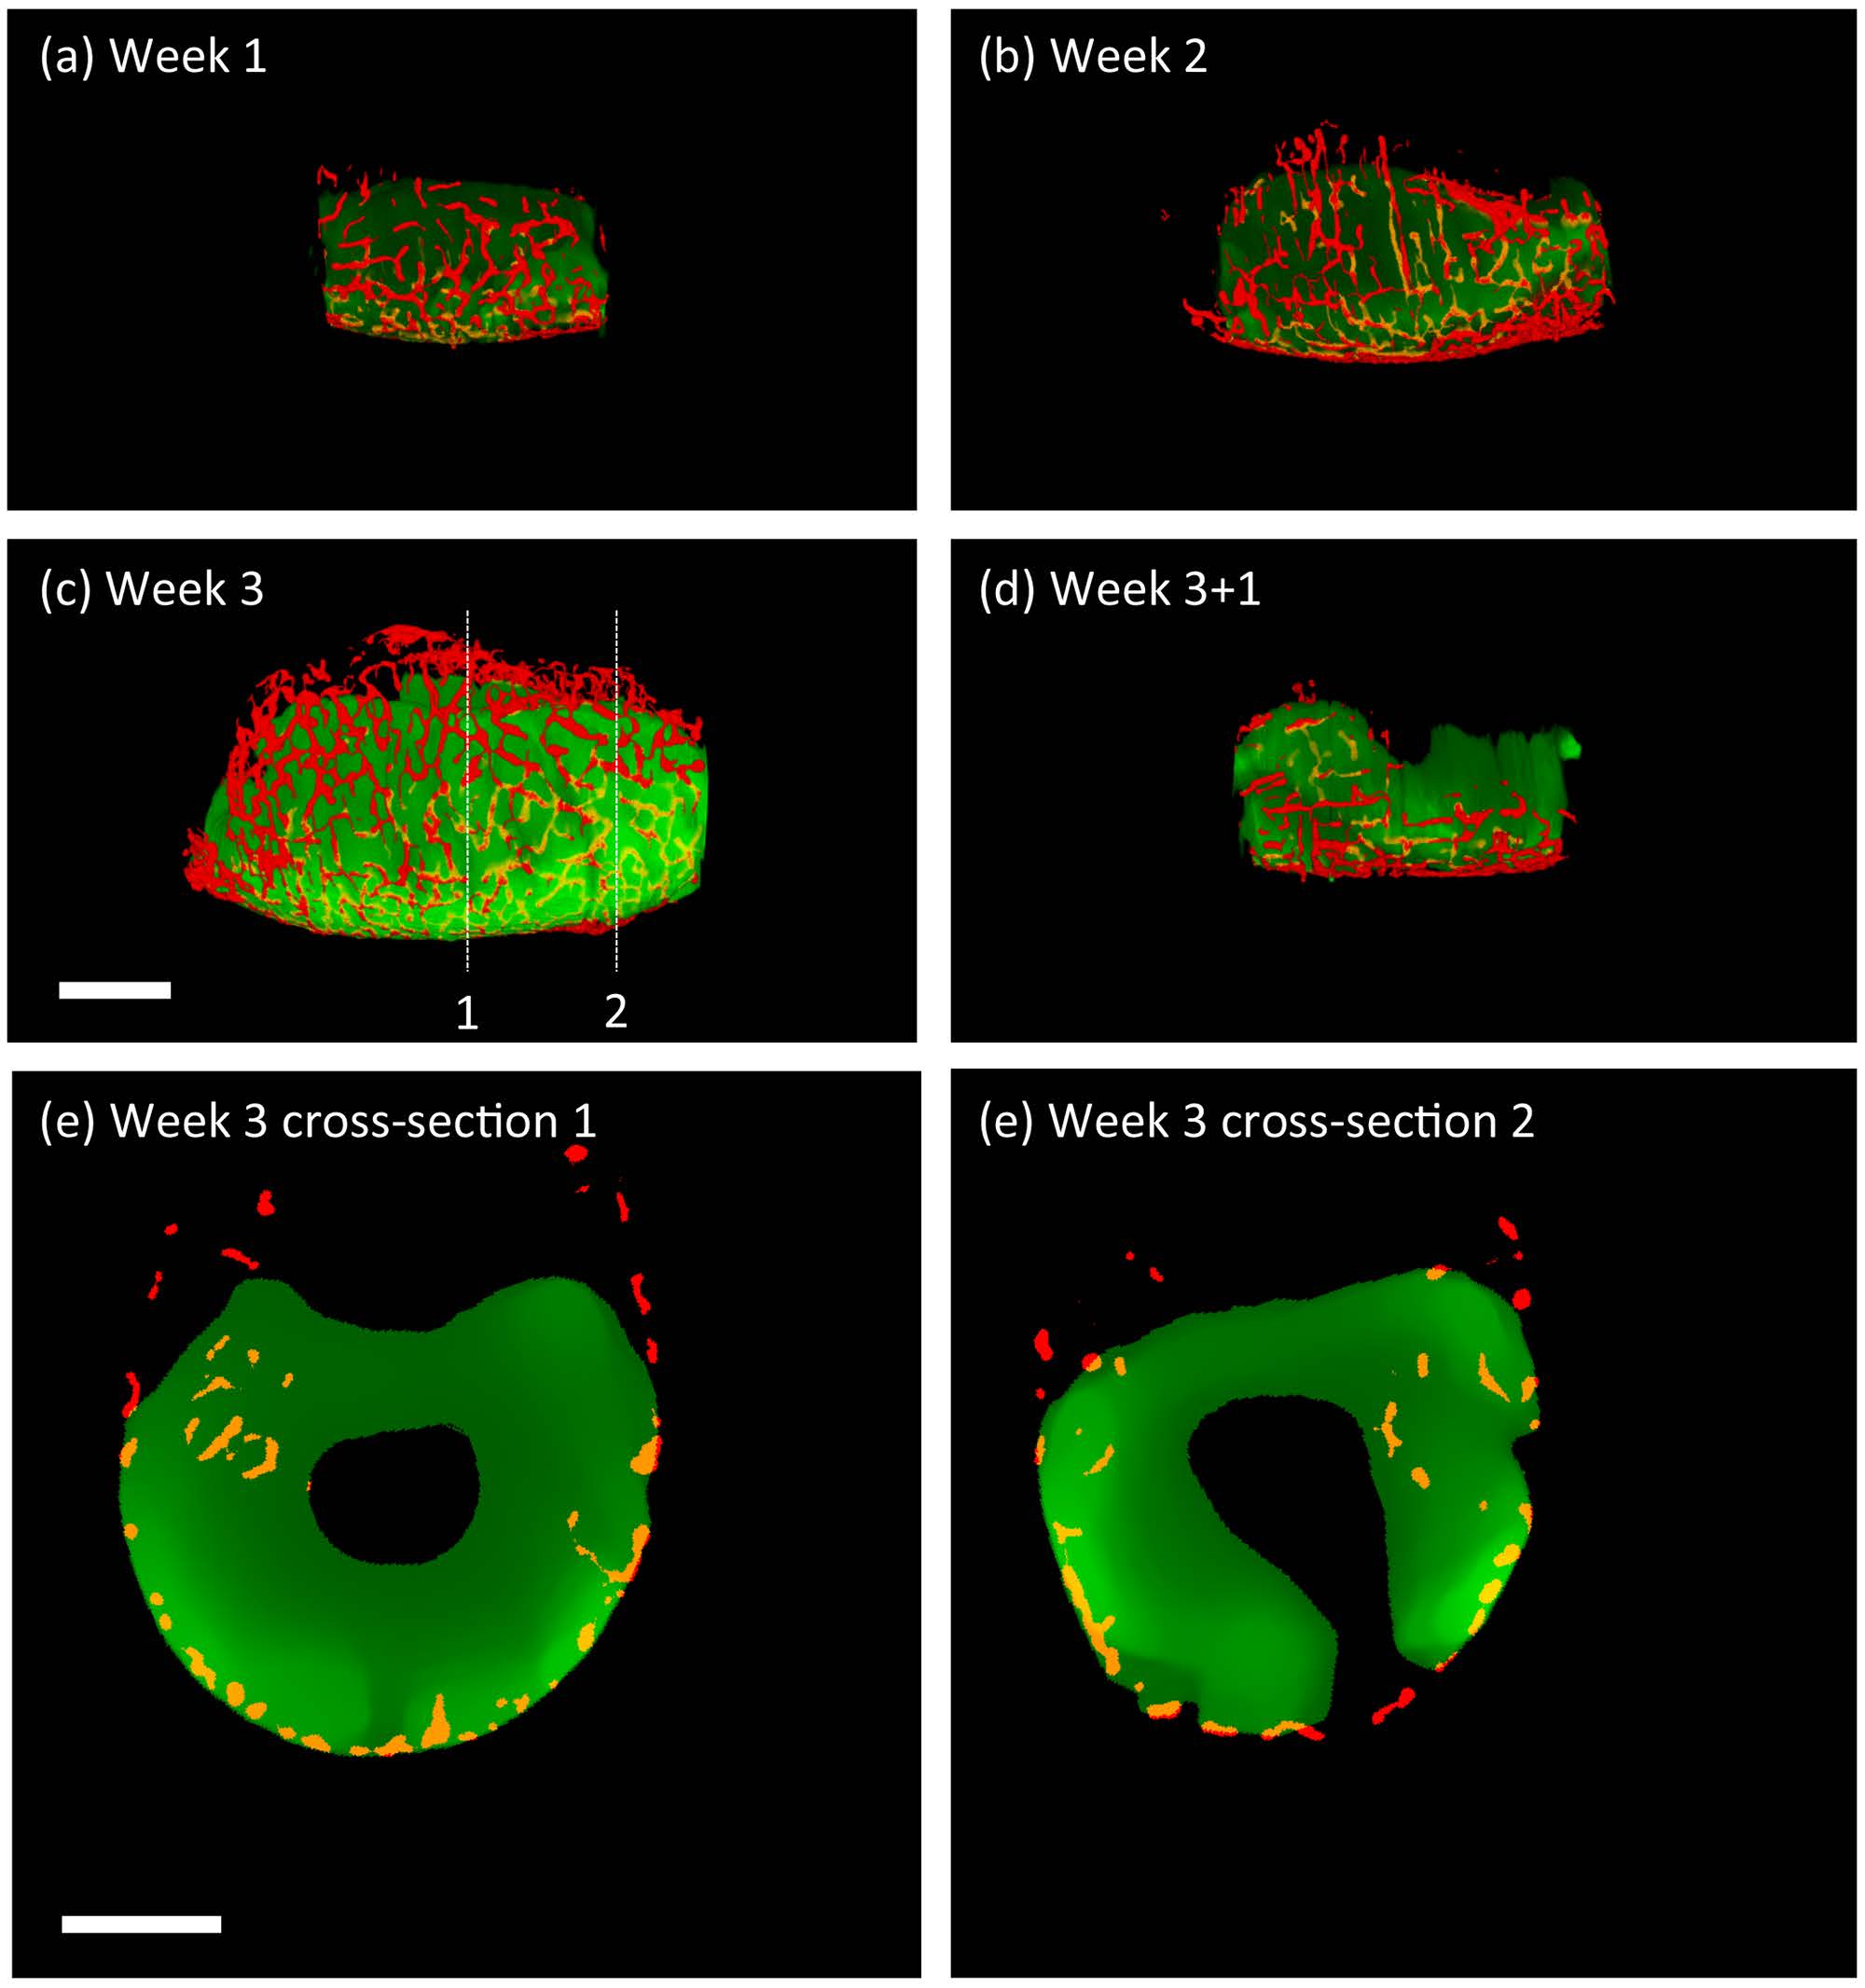
a-d. Representative “final” segmented reconstructed CS-OPT images of eGFP-labelled tumour and mCherry-labelled vasculature in adult TraNac Tg (KDR:mCherry;Fabp10:rtTA;TRE:eGFP:KRASV12) zebrafish with data acquired following DOX treatment at 145 dpf after (a) one, (b) two, (c) three weeks of treatment and (d) after three weeks of DOX treatment plus a further week with no treatment (See also Supplementary Video 3). e, f. Representative cross-sections showing tumour and vasculature from the reconstructed volume shown in (c) indicated by dotted lines 1 and 2 respectively. Red – vasculature ‘outside’ tumour, orange – vascular ‘inside’ tumour, green - tumour. Scale bar 2 mm.