
|
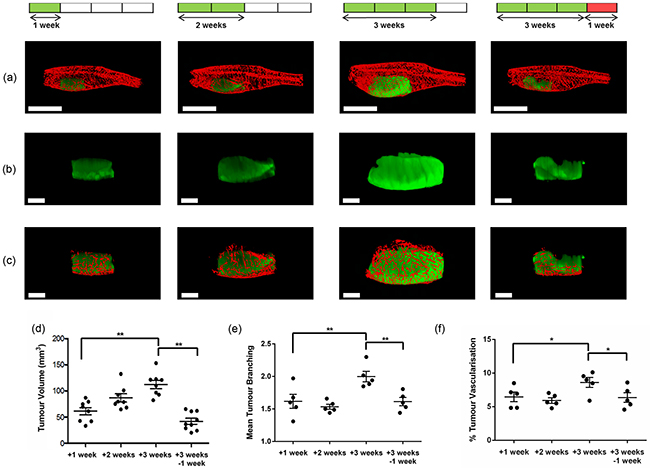
Fig. 3
a-c. Representative “final” segmented reconstructed CS-OPT images of eGFP-labelled tumour and mCherry-labelled vasculature in adult TraNac Tg (KDR:mCherry;Fabp10:rtTA;TRE:eGFP:KRASV12) zebrafish with data acquired following DOX treatment at 145 dpf after one, two and three weeks of treatment and after three weeks of DOX treatment plus a further week with no treatment (See also Supplementary Videos S2-S3). (a) shows whole images of tumour and vasculature (scale bar = 5 mm); (b) and (c) show the corresponding CS-OPT images (scale bar = 2 mm) of the of the tumour alone and of the segmented vasculature associated with the tumour. d, e, f. respectively are graphs plotting the corresponding variation of the mean tumour volume, the mean number of tumour vessel branch points and percent tumour vascularisation (proportion of vasculature volume within tumour volume) calculated from this OPT data set, for which n≥5 at each condition and the error bars represent the standard error of the mean (SEM). *p<0.05, **p<0.01 as indicated by lines.