
Image
|
Figure Caption
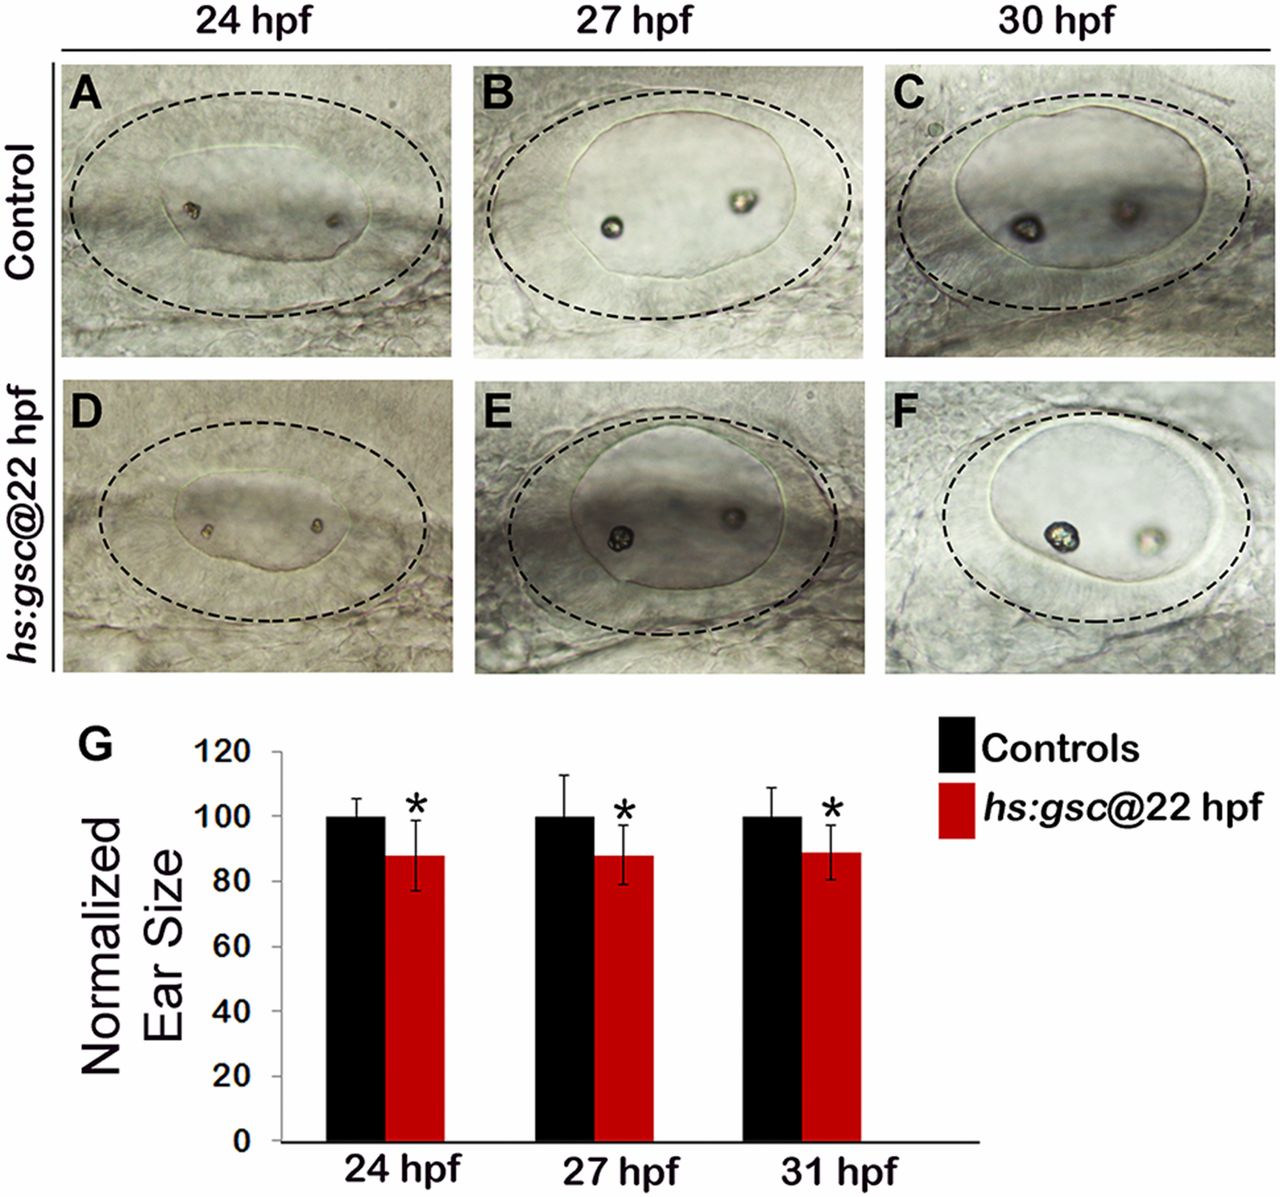
Fig. S6
The size of the otic vesicle declines following activation of hs:gsc. (A–F) Whole-mount live specimens show dorsolateral views of the otic vesicle in controls (A–C) and hs:gsc embryos (D–F). (G) Means and SD of surface area of the otic vesicle, normalized to control embryos, are indicated for hs:gsc embryos at the indicated time points. Significant differences (P < 0.05) from the control are indicated with asterisks.
Acknowledgments
This image is the copyrighted work of the attributed author or publisher, and
ZFIN has permission only to display this image to its users.
Additional permissions should be obtained from the applicable author or publisher of the image.
Full text @ Proc. Natl. Acad. Sci. USA