
|
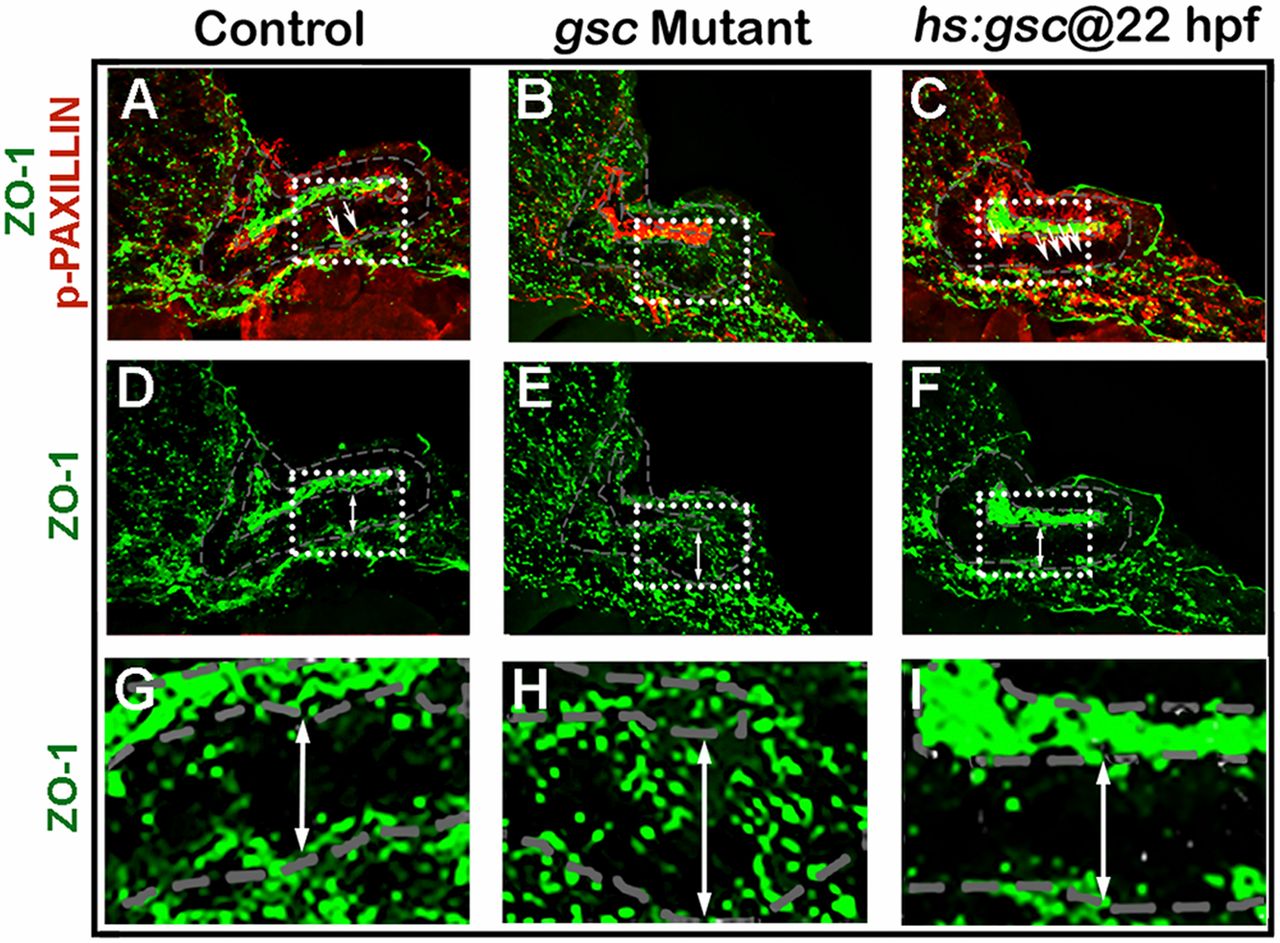
Fig. S5
Effects of altering gsc function on ZO-1 and p-Paxillin. (A–I) Cross-sections through the neurogenic domain just posterior to the utricular macula in a control embryo (A, D, and G), gsc mutant (B, E, and H) and hs:gsc embryo (C, F, and I) at 24 hpf. These are the same sections depicted in Fig. 2 K–P but showing costaining for p-Paxillin (red) and ZO-1 (green) (A–C) or ZO-1 alone (D–I). The boxed regions in A–F are enlarged in G–I. White arrows (A–C) indicate cells undergoing EMT with elevated basal accumulation of p-Paxillin, whereas double-headed arrows (D–I) span the otic epithelium to highlight changes in ZO-1 staining.