
|
Fig. S2
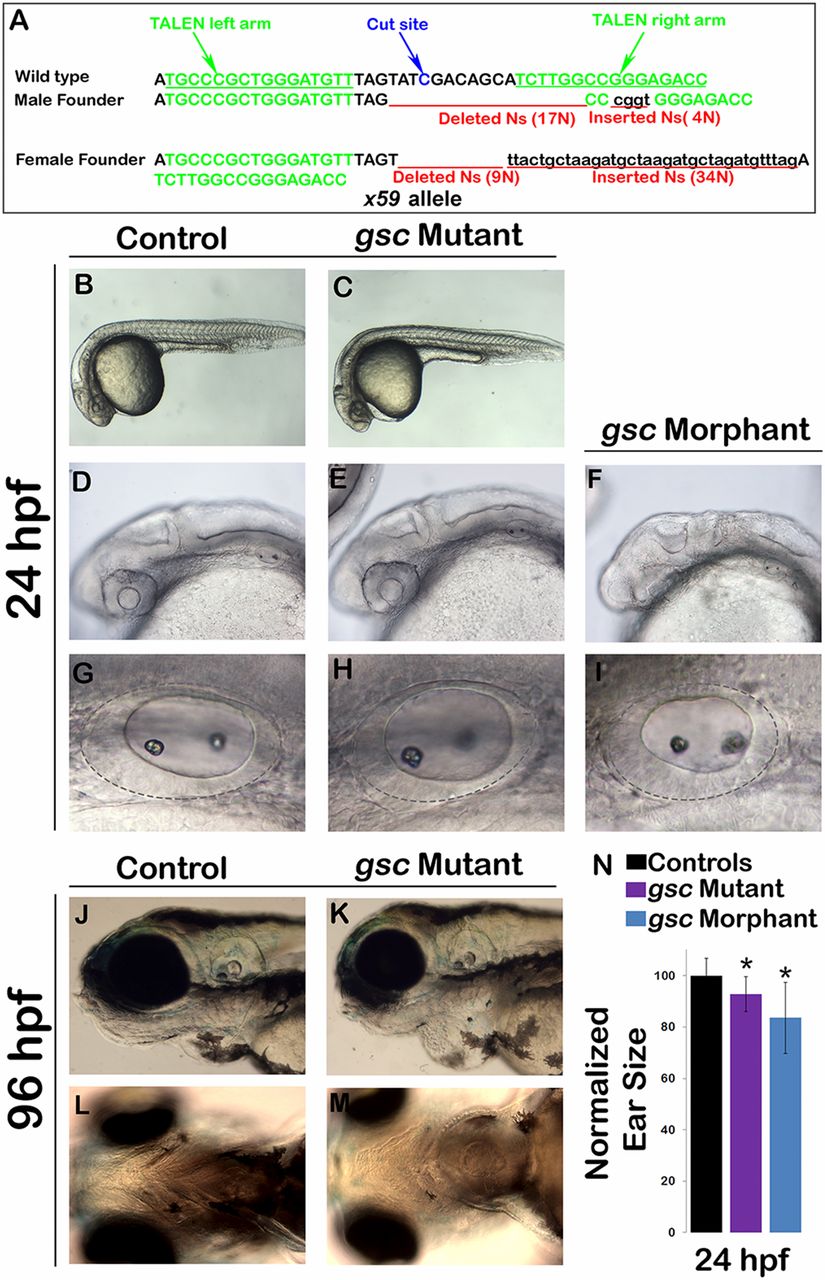
Generation of gsc mutants via TALEN targeting. (A) A summary of the TALEN target sequences on the first exon of the gsc locus (marked in green) and the resulting lesions (marked in red) at the predicted cut site (marked in blue) are shown for the two F1 founders isolated during the screening process. (B–I) Live specimens at 24 hpf were viewed at low magnification to show general morphology (B and E) and at higher magnifications to show cranial development (D–F) and the otic vesicle (G–I) in controls, gsc morphants, and gsc mutants. (J–L) Live specimens at 96 hpf viewed from lateral (J and K) or ventral (L and M) reveal cardiac edema and jaw hypoplasia in gsc mutants. (N) Means and SD of surface area of the otic vesicles, normalized to control embryos, are indicated for gsc mutants and gsc morphants at 24 hpf. Asterisks indicate statistically significant differences from the control (P < 0.05).