
|
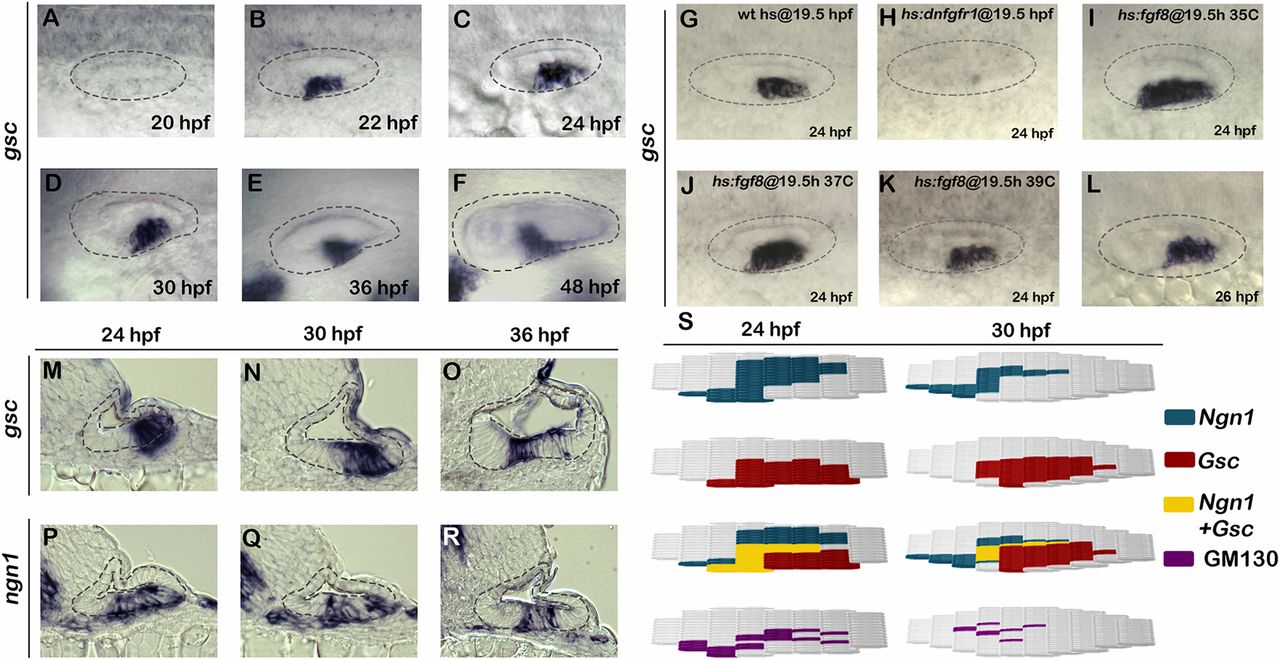
Fig. 1
Expression and regulation of gsc during otic neurogenesis. (A–L) Whole-mount images (dorsal up, anterior left) show dorsolateral views of gsc expression in the otic vesicle (outlined) at the indicated times. (M–R) Cross-sections (dorsal up, medial left) passing through the widest part of the neurogenic domain showing expression of gsc or ngn1 at the indicated times. The otic epithelium is outlined in each image. (Magnification: F, 512×; all other images, 640×.) (S) Maps of regional markers in the floor of the otic vesicle (medial up, anterior left) generated from serial cross-sections of embryos stained for ngn1, gsc, or GM130 at 24 or 30 hpf. The location and number of cells expressing individual markers (four embryos each) was normalized and plotted accordingly.