
|
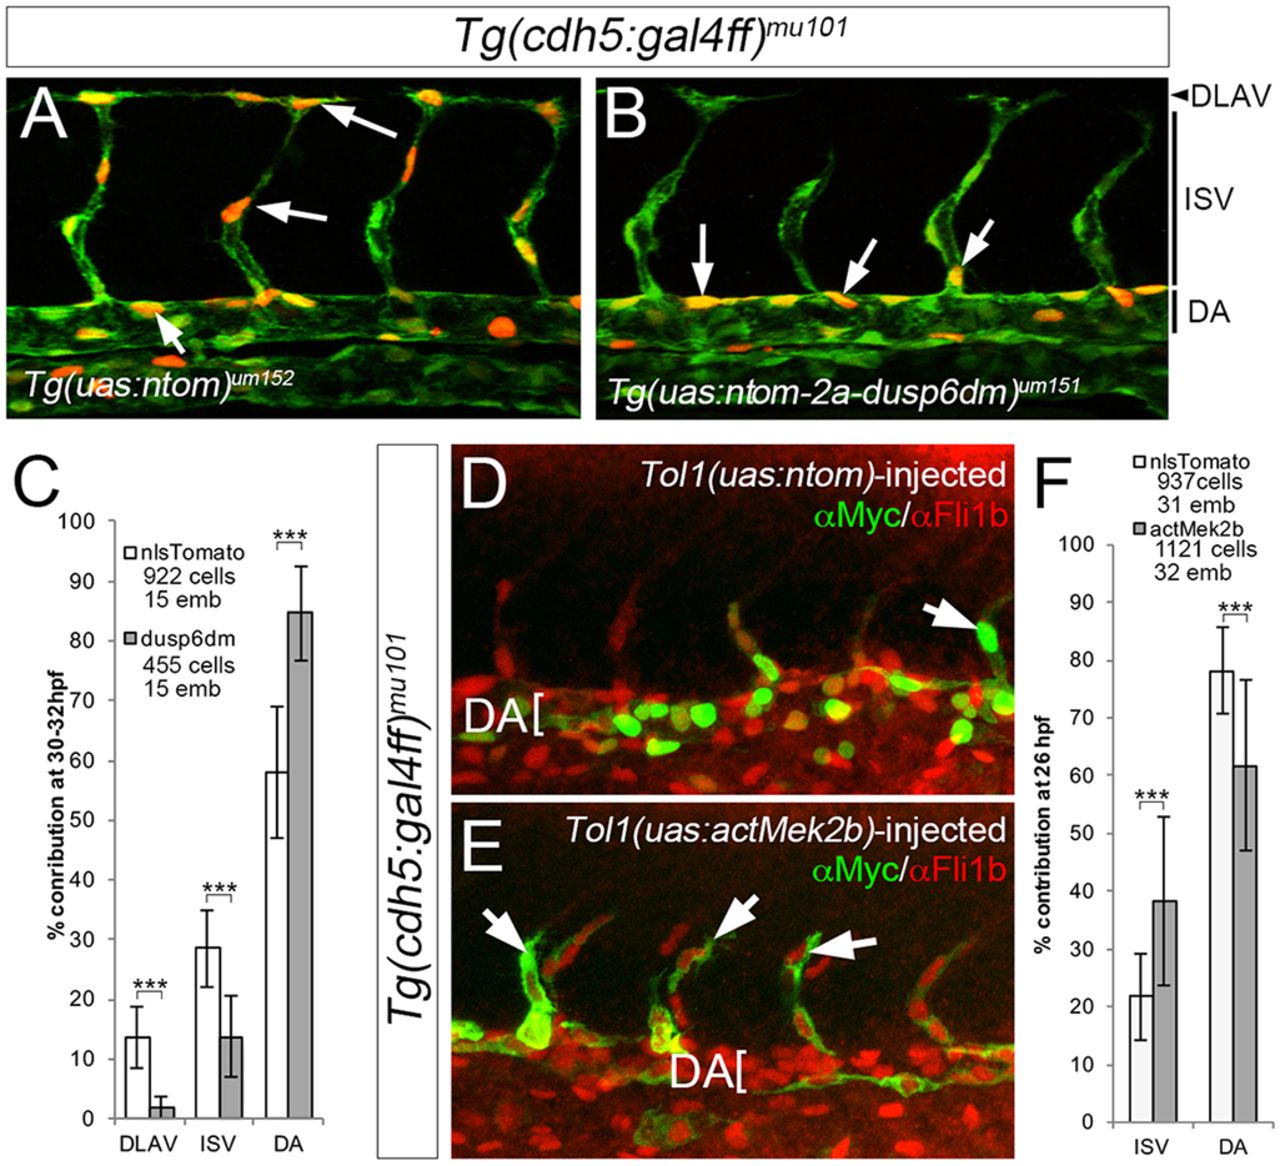
Fig. 4
Endothelial cell-autonomous inhibition of ERK blocks ISV sprouting. (A,B) Confocal images of Tg(cdh5:gal4ff)mu101;(uas:egfp)nkuasgfpa1 embryos bearing the indicated transgenes. uas:egfp is green, nTom is red; selected nTom-positive cells indicated by arrows. Vessel positions shown on the right. (C) Contribution of nlsTom- or dusp6dm-expressing cells to the indicated vessel between 30 and 32 hpf. ***P<0.001. (D,E) Confocal images of Tg(cdh5:gal4ff)mu101 embryos injected with Tol1 transgenes expressing nTom (D) or actMek2b (E) immunostained for Myc (green) and Fli1b (red). Arrows denote transgene-expressing ISV cells. (F) Quantification of nTom- and actMek2b-expressing endothelial cells in the indicated vessel at 23 hpf. (C,F) Numbers of cells and embryos used for quantification are shown. Error bars represent s.d.