
IMAGE
Fig. S4
- ID
- ZDB-IMAGE-161130-9
- Publication
- Grainger et al., 2016 - Wnt9a Is Required for the Aortic Amplification of Nascent Hematopoietic Stem Cells
- All Figures
- Figures for Grainger et al., 2016
Image
|
Figure Caption
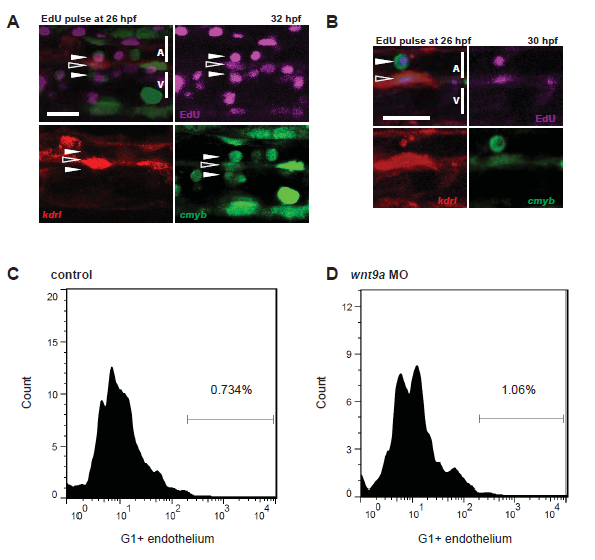
Fig. S4
Proliferation in the aorta.
kdrl:mCherry; cmyb:GFP fish were injected with 10mM EdU at 26 hpf and examined by confocal microscopy for GFP+;mCherry+ cells that had proliferated (EdU+, purple) by 32 hpf (A. n=10) or 30 hpf (B. n=10). Open arrows indicate nascent HSPCs, while closed arrows indicate HSPCs that are undergoing EHT. FACS histograms in control (C) and Wnt9a morphant (D) fish sorted for G1 (mCherry+) and endothelium (GFP+). Note the increase in endothelial cells in the G1 fraction of wnt9a morphants. Scale bars= 30µm. Error bars represent standard deviation.
Acknowledgments
This image is the copyrighted work of the attributed author or publisher, and
ZFIN has permission only to display this image to its users.
Additional permissions should be obtained from the applicable author or publisher of the image.
Full text @ Cell Rep.