
Fig. S1
- ID
- ZDB-IMAGE-161130-6
- Publication
- Grainger et al., 2016 - Wnt9a Is Required for the Aortic Amplification of Nascent Hematopoietic Stem Cells
- All Figures
- Figures for Grainger et al., 2016
|
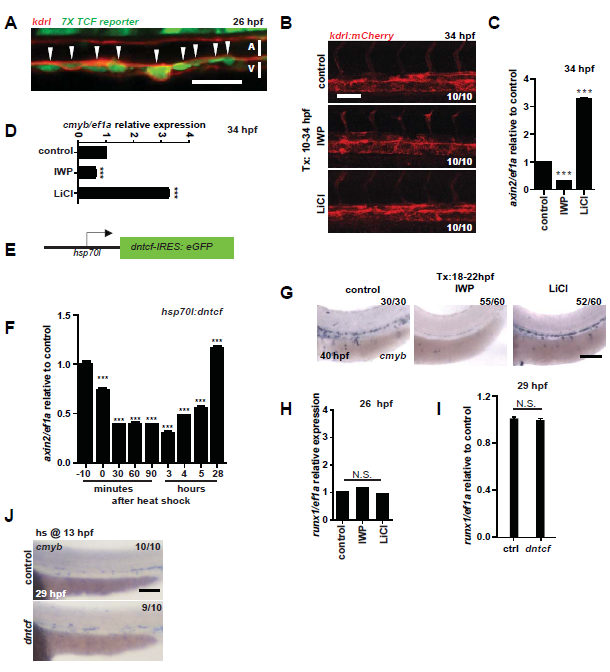
Fig. S1
Wnt Signaling affects HSPCs.
A. kdrl:mCherry; 7X TCF:eGFP fish were imaged at 26 hpf. Scale bar= 30µm. B. The dosages used did not alter overall morphology or vasculature as measured by expression of the vascular marker kdrl:mCherry. Scale bar= 30µm. C. Trunk and tail tissue from wildtype AB* fish under the same treatment regimen were examined; an effect on Wnt signaling was confirmed at 34 hpf by qPCR for expression of the Wnt target gene axin2 (n=15). HSPCs were examined by qPCR at 34 hpf for marker cmyb (D. n=20) in dissected trunks and tails of larvae. E. hsp:dntcf fish were heat shocked and compared to AB* for axin2 by qPCR to assess Wnt activity following dntcf induction (n=20 at each time point) (F). G. AB* zebrafish were treated with IWP-L6 or LiCl from 18-22 hpf and analyzed at 40 hpf by WISH for cmyb. Scale bar= 0.1mm. H. HSPCs were examined by qPCR at 26 hpf for marker runx1 (n=20). I. hsp:dntcf fish were heat shocked at 13 hpf and analyzed for runx1 (n=30), compared to AB* controls. J. hsp:dntcf fish were heat shocked at 13 hpf and analyzed for cmyb at 29 hpf, compared to AB* controls. Scale bar= 0.1mm ****P<0.0001, n.s.=not significant. Error bars represent standard deviation.