
|
Fig. 4
HSPCs Expand in the Aorta
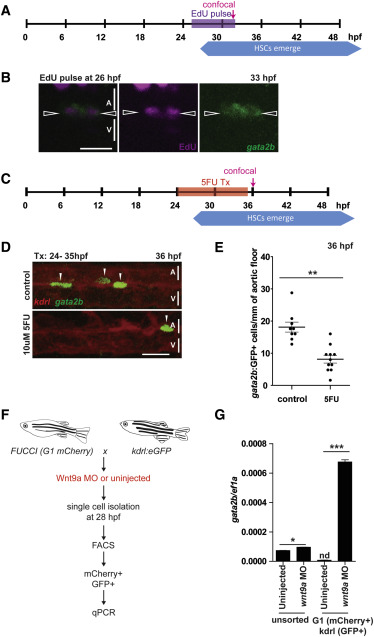
(A) The heart tubes of gata2b:GFP fish were injected with 1 nL of 10 mM EdU at 26 hpf, and fixed and stained for cells that had divided as well as GFP at 33 hpf (n = 10).
(B) Representative confocal image of gata2b+ cells that have undergone cell division in the aorta (arrowheads).
(C–E). gata2b:GFP;kdrl:mCherry fish were treated with 10 μM 5′ fluorouracil (5FU) from 24 to 35 hpf (C), confocal imaged at 36 hpf (D), and gata2b+ cells quantified (E).
(F and G) G1 arrested (mCherry+) endothelial cells (GFP+) from wnt9a morphant and control fish (n = 100 embryos per condition) were collected by FACS at 28 hpf (F) and compared by qPCR for gata2b (G).
Scale bars, 30 μm. Error bars represent SD. See also Figure S4.