
Image
|
Figure Caption
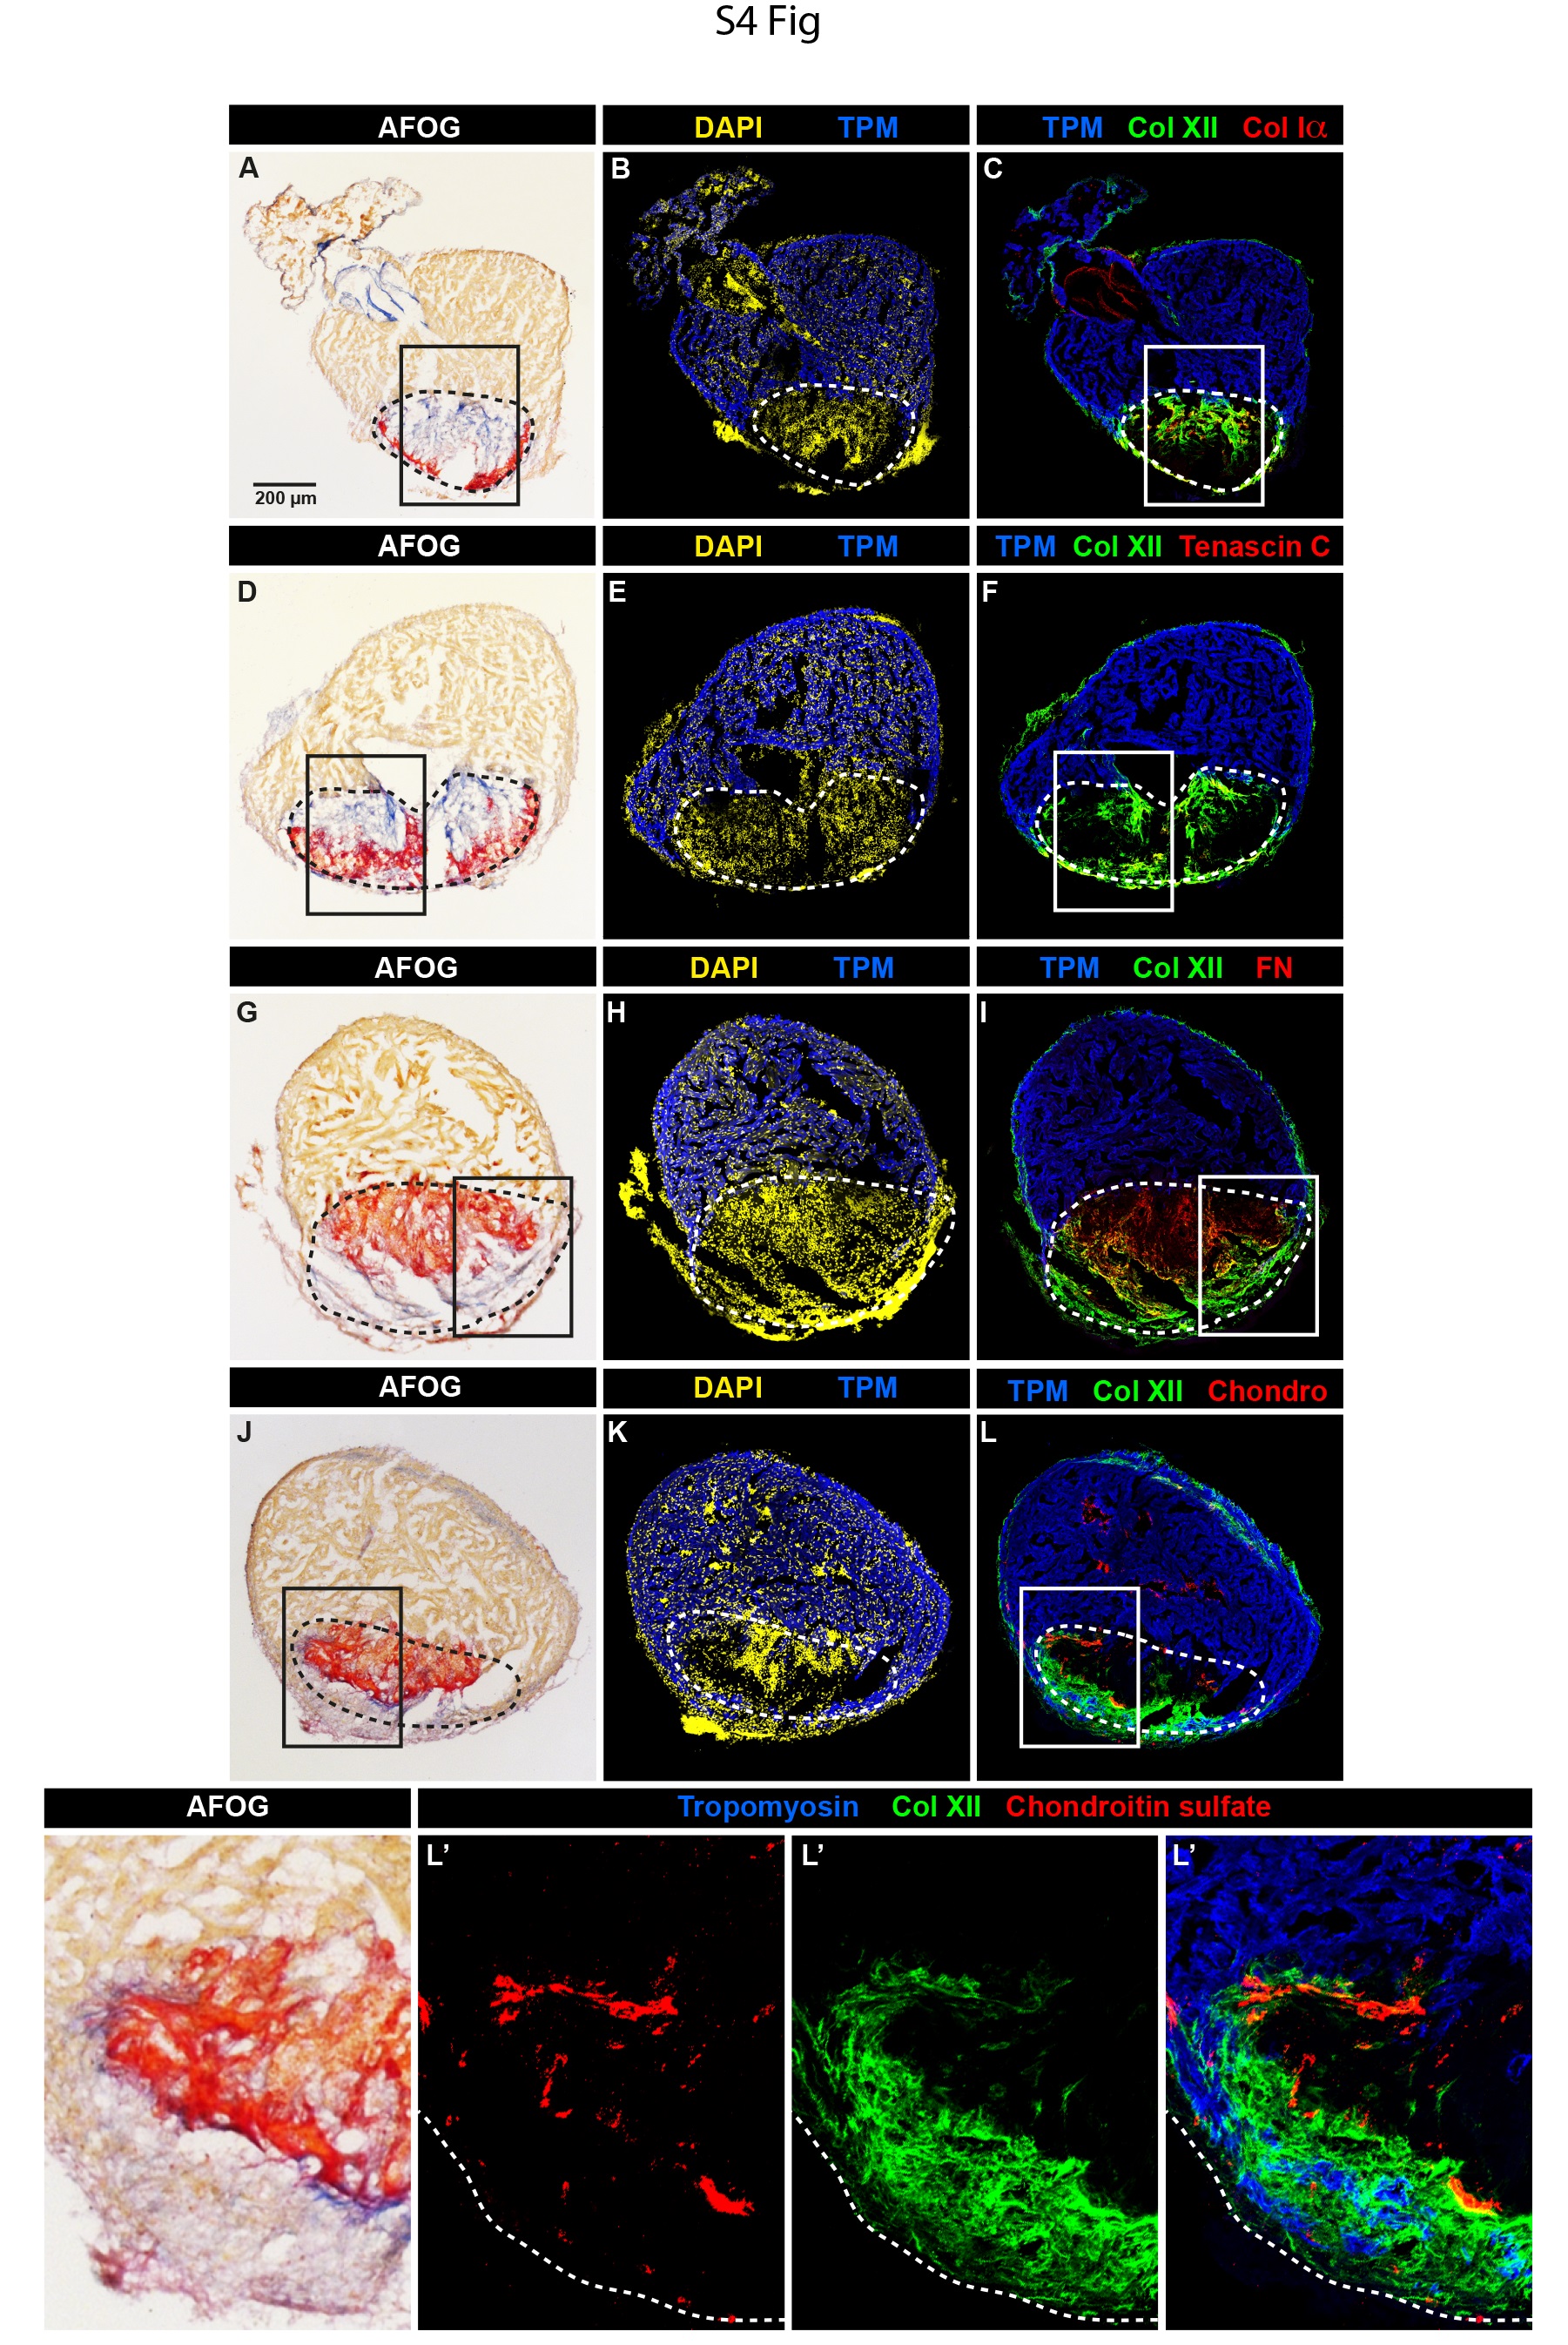
Fig. S4
Complete ventricle sections that were used for analysis of fibrotic tissue at 14 dpci in Figure 5.
(A-I) The framed areas correspond to the selected regions that are shown at higher magnification in Figure 5. Dashed line encircles the fibrotic tissue. (J-L') Chondroitin sulfate (red) does not markedly co-localize with Col XII (green).
Acknowledgments
This image is the copyrighted work of the attributed author or publisher, and
ZFIN has permission only to display this image to its users.
Additional permissions should be obtained from the applicable author or publisher of the image.
Full text @ PLoS One