
IMAGE
Fig. 4
- ID
- ZDB-IMAGE-161123-4
- Publication
- Zhang et al., 2010 - Highly aneuploid zebrafish malignant peripheral nerve sheath tumors have genetic alterations similar to human cancers
- All Figures
- Figures for Zhang et al., 2010
Image
|
Figure Caption
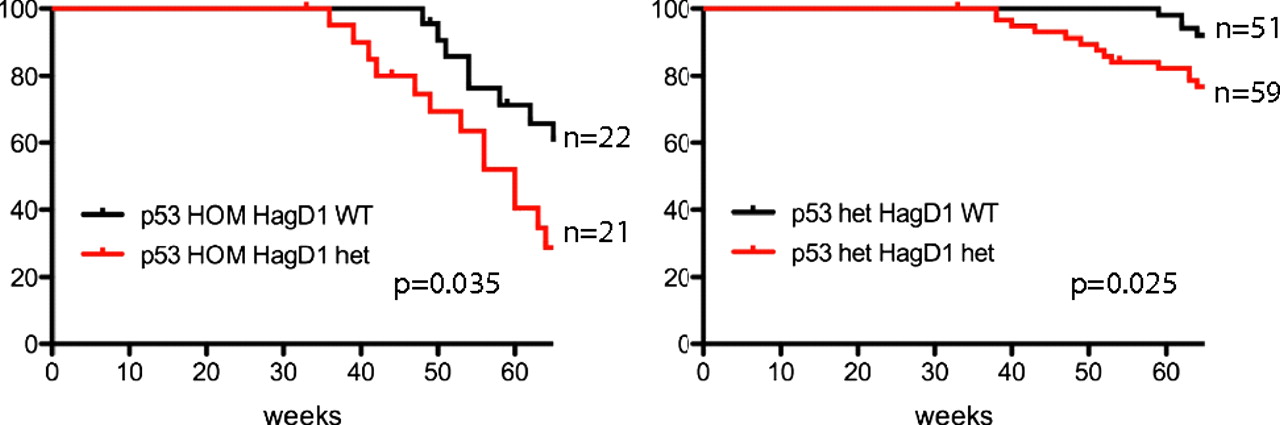
Fig. 4
Overexpression of fgf8a synergizes with mutation of p53 in MPNST development. Kaplan–Meier curves indicate when externally visible tumors were first observed in fish with the indicated genotypes. All fish were progeny of the same four pairs born the same day. Tumor type was confirmed by histological analysis, and fish with neuroblastoma (1 in p53 HOM, HagD1 het, 1 in p53 het, HagD1 het) were excluded from the analysis. No MPNSTs were found in p53 WT, HagD1 heterozygous fish. P values comparing genotyped pairs are shown.
Figure Data
Acknowledgments
This image is the copyrighted work of the attributed author or publisher, and
ZFIN has permission only to display this image to its users.
Additional permissions should be obtained from the applicable author or publisher of the image.
Full text @ Proc. Natl. Acad. Sci. USA