
|
Fig. S3
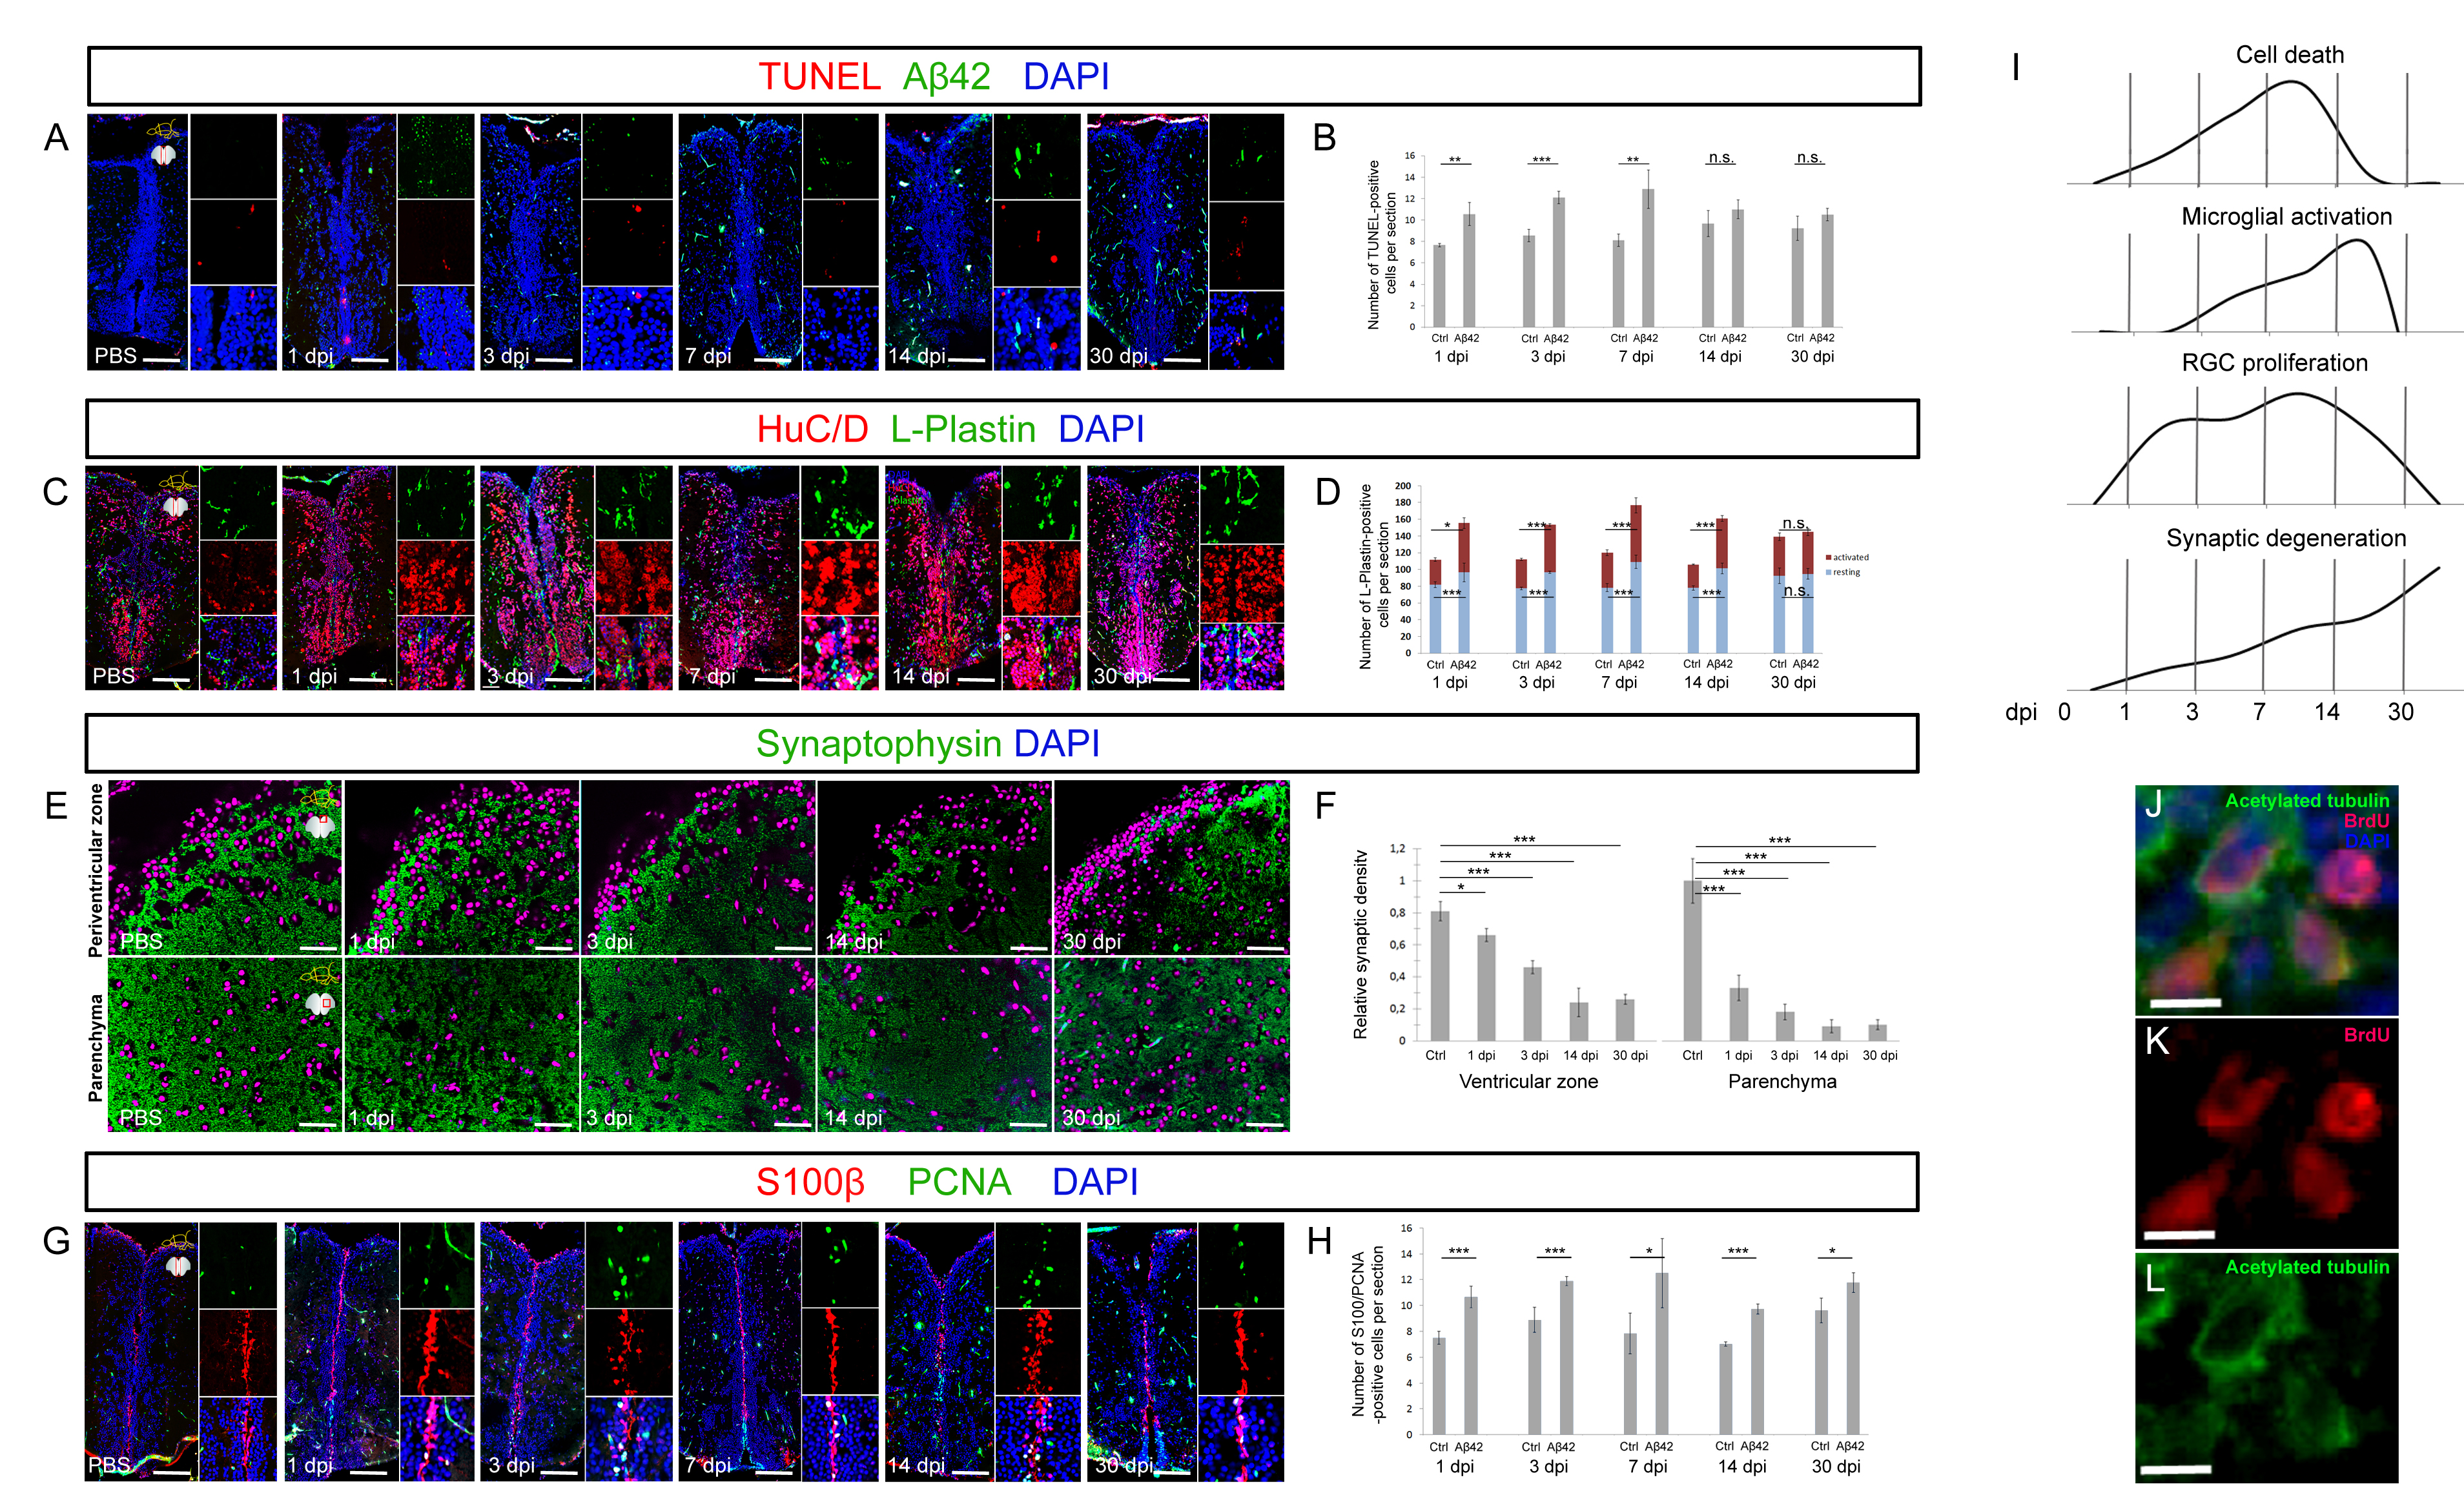
Time course analyses of cell death, microglial activation, synaptic degeneration and cell proliferation in adult zebrafish brain after Aβ42 injection. Related to Figure 1, Figure 3.
(A) TUNEL staining and immunohistochemistry (IHC) for Aβ42 in PBS-injected controls and TR-Aβ42-injected brains at 1, 3, 7, 14, 30 dpi.
(B) Quantification graph for A.
(C) HuC/D and L-Plastin IHC in PBS-injected controls and TR-Aβ42-injected brains at 1, 3, 7, 14, 30 dpi.
(D) Quantification graph for C.
(E) Synpatophysin IHC in PBS-injected controls and TR-Aβ42-injected brains at 1, 3, 7, 14, 30 dpi.
(F) Quantification graph for E.
(G) S100 and PCNA IHC in PBS-injected controls and TR-Aβ42-injected brains at 1, 3, 7, 14, 30 dpi.
(H) Quantification graph for G.
(I) Timeline of phenotypic outcomes.
(J) Close-up image of Acetylated tubulin (green) and BrdU (red) staining. DAPI (blue) as a counterstain.
(K) Red channel of image in J.
(L) Green channel of image in J. Scale bars: 50 μm (A, C, E, G), 10 μm (J-L). Data are represented as mean ± SD.