
|
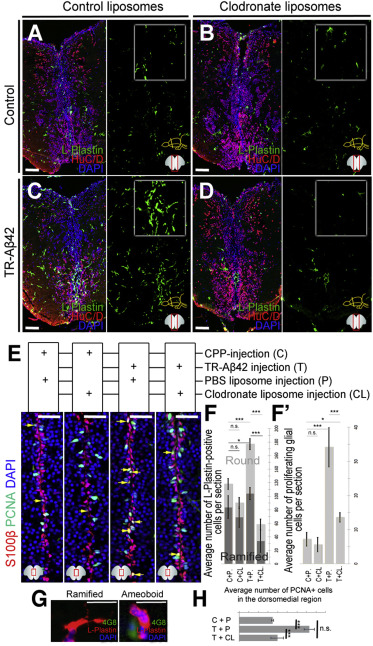
Fig. 3
Aβ42-Dependent Stem Cell Proliferation Requires Microglial Activity
(A–D) L-plastin and HuC/D in control peptide/control liposome (A), control peptide/clodronate liposome (B), TR-Aβ42/control liposome (C), and TR-Aβ42/clodronate liposome (D) injections. Right panels: green channel.
(E) S100β and PCNA in brains injected with the four combinations in (A–D).
(F) Quantification of the number of L-plastin-positive cells.
(F') Quantification of proliferating NSPCs.
(G) Examples of ramified and round/ameoboid L-plastin-positive cells. Round cells are around amyloid (green, 4G8 staining).
(H) Quantification for the average number of PCNA-positive cells in clodronate-injected brains.
Scale bars, 50 μm. Data are represented as mean ± SD; n = 4 fish. ∗p < 0.05; ∗∗∗p < 0.001; n.s., not significant. See also Tables S1 and S2.