
|
Fig. 6
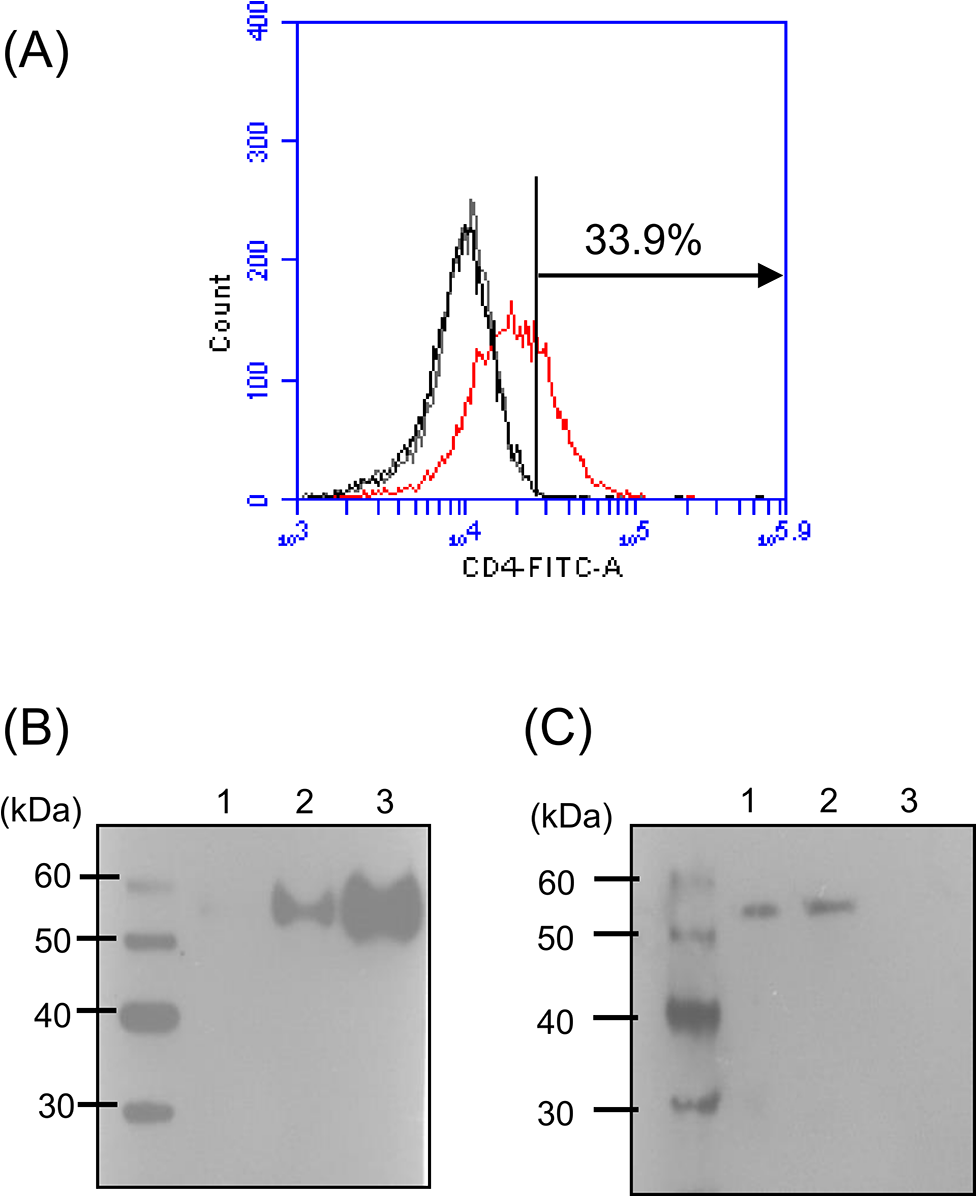
Zebrafish CD4-1 protein expression in transfected CHO cells and zebrafish tissues.
(A) FACS analysis of zfCD4-1 positive cells in CHO cells transfected with zfCD4-1. Cells reacted with only secondary antibody or the pre-immune rabbit serum and secondary antibody are shown in the black and grey histogram, respectively, whilst cells incubated with zfCD4-1 polyclonal antibody and secondary antibody are shown in the red histogram. Note the increase in fluorescence intensity of the latter, as shown by a shift to the right. (B) and (C), Western blot analysis of zfCD4-1 protein. (B) Un-transfected CHO cell lysate (5 μl) (lane 1), and zfCD4-1 transfected CHO cell lysates (5μl, lane 2; 10μl, lane 3). (C), zf blood cell lysate (lane 1), kidney lysate (lane 2) and muscle lysate (lane 3). The data are representative of 3 independent experiments.