
|
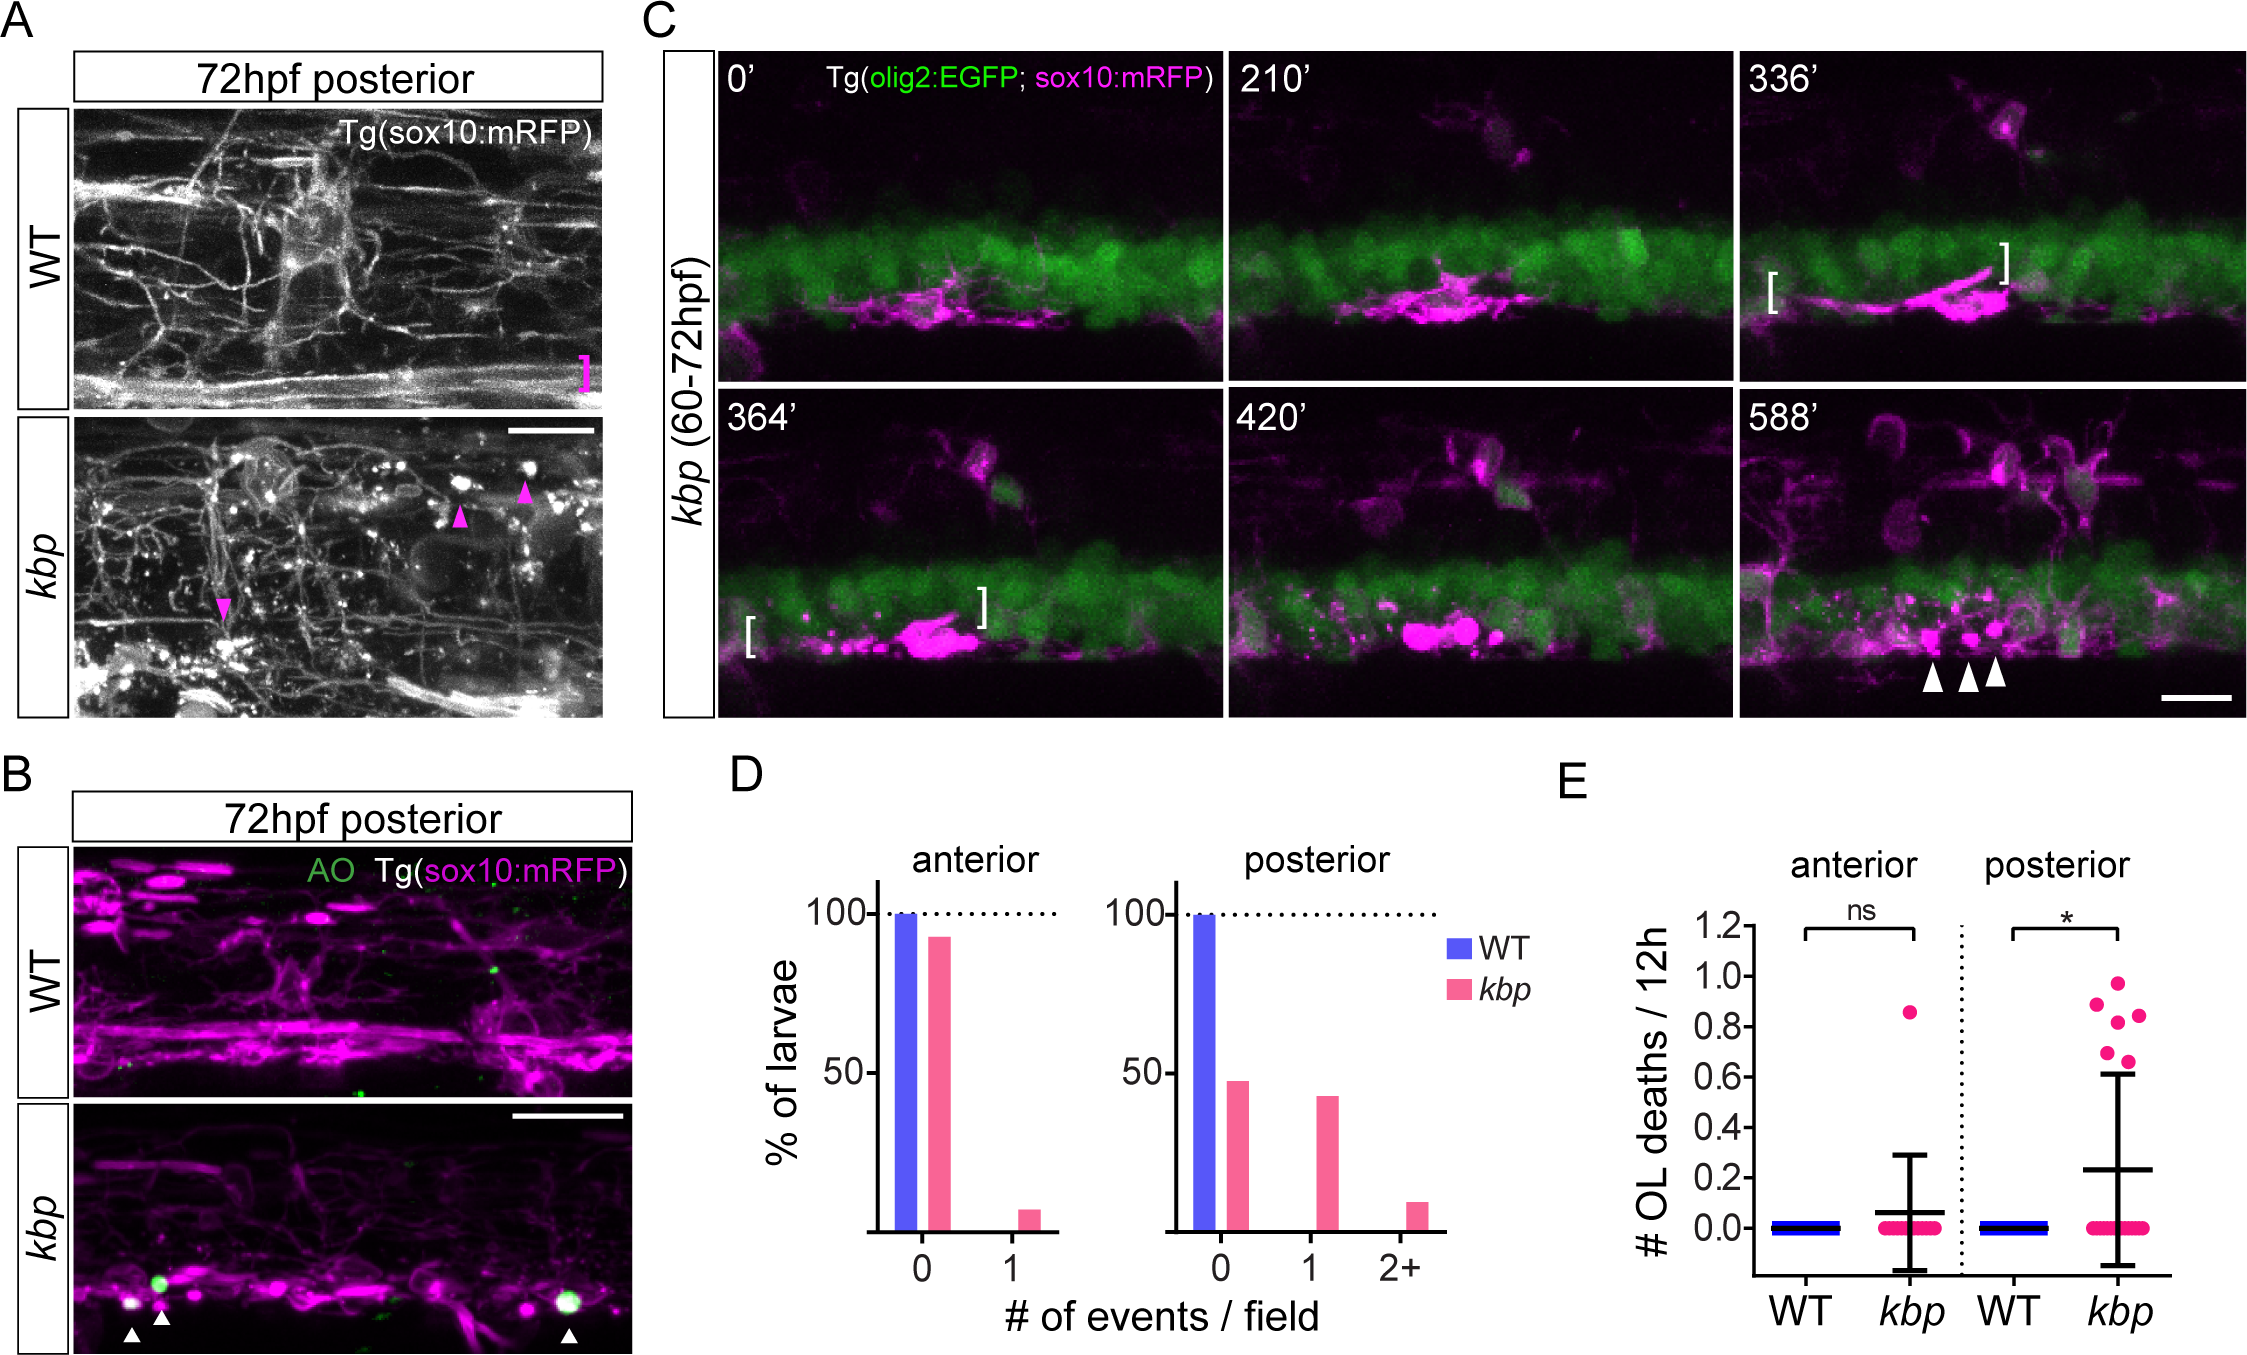
Fig. 9
Impaired survival of a subset of oligodendrocyte-lineage cells in the posterior spinal cord of kbp mutants.
A, High-magnification live-imaging of the posterior spinal cord of 72hpf Tg(sox10:mRFP) larvae, with Mauthner axon myelin sheaths in WTs (pink bracket) and mRFP+ debris in mutants (pink arrowheads). Scale bars: 10 μm B, Posterior spinal cord of 72hpf Tg(sox10:mRFP) larvae stained with Acridine Orange; mutants have AO+ foci (arrowheads). See text for details. Scale bar: 20 μm. C, Time-lapse stills showing a mutant oligodendrocyte forming a myelin sheath (brackets) and then dying, originating mRFP+ debris (arrowheads). Scale bar: 10μm. D, Proportion of larvae with oligodendrocyte death events: essentially only mutants show any events, only in the posterior spinal cord. E, Rate of oligodendrocyte (OL) death (per 12-hour) is significantly elevated only in the posterior spinal cord of kbp mutants. Data from N = 18 WT and N = 14 mutants (anterior) and N = 18WT and N = 21 mutants (posterior). * indicates P<0.05; see text for details. Error bars indicate ± SD.