
Fig. 1
- ID
- ZDB-IMAGE-161111-4
- Genes
- Publication
- Cortes et al., 2016 - Developmental Vitamin D Availability Impacts Hematopoietic Stem Cell Production
- All Figures
- Figures for Cortes et al., 2016
|
Fig. 1
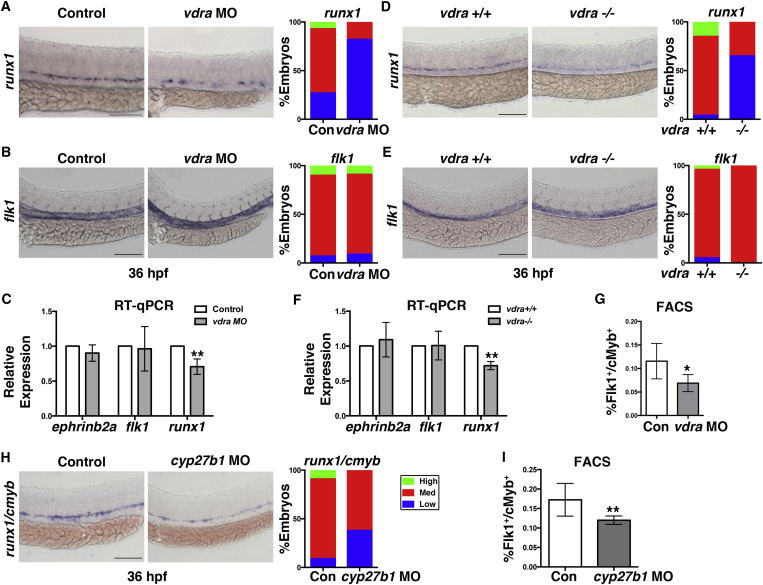
VDR Is Necessary for Zebrafish Definitive Hematopoiesis
(A) Representative runx1 WISH images and qualitative phenotype distribution (high/medium/low, n ≥ 30 embryos/condition) of vdra MO-injected embryos and sibling controls at 36 hpf. Error bars, mean ± SD.
(B) WISH example and phenotype distribution for flk1 in vdra morphants (n ≥ 20 embryos/condition).
(C) qPCR analysis quantifying the impact on HSPCs (runx1, ∗∗p < 0.01) and hemogenic endothelium (flk1, ephrinb2a, p = N.S.) in control and vdra morphants (30 embryos/sample × 3 replicates).
(D-F) Representative WISH (D), phenotype distributions (E), and qPCR quantification (F) of vdra mutant embryos (runx1, ∗∗p < 0.01; flk1, ephrinb2a, p = N.S.) phenocopied the impact on HSPCs but not on vessels.
(G) FACS analysis of vdra morphants indicated significant reductions in Flk1:dsRed+/cMyb:GFP+ HSPCs (∗p < 0.05) at 48 hpf (5 embryos/sample × 4 replicates/condition). Error bars, mean ± SD.
(H) WISH samples and phenotype distribution of runx1/cmyb expression in cyp27b1 MO-injected embryos at 36 hpf (n ≥ 30 embryos/condition).
(I) FACS analysis showed a significant decrease in HSPCs (∗∗p < 0.01) with cyp27b1 MO injection (n value and error bars as in C).
Scale bars, 100 μm. See also Figure S1.