
|
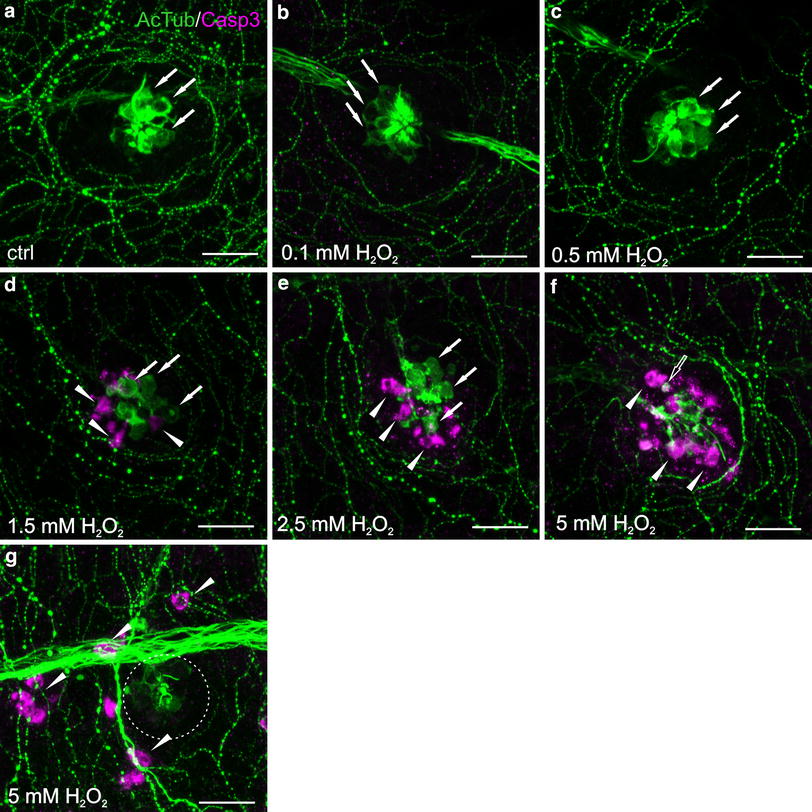
Fig. 2
Morphology of L2 neuromast hair cells in 5 dpf zebrafish (see Fig. 3) exposed for 1 h to H2O2 in dose-dependent manner, double-stained with antibodies against acetylated α-tubulin (AcTub) (green) and caspase-3 (Casp3) (magenta). The visualization was accomplished using a Zeiss LSM-700 confocal microscope. Life hair cells were stained with anti-AcTub antibody (arrows) and the apoptotic hair cells were marked with anti-Casp3 antibody (arrow heads). a Hair cells in the control group characterized by proper morphology without any apoptosis. b, c Low H2O2 doses resulted in unchanged hair cells morphology after both 0.1 mM (b) and 0.5 mM (c) H2O2 exposure. d 1.5 mM is the minimum H2O2 concentration resulted in strong and evident apoptosis recognized based on Casp3 detection (arrow heads). Casp3 immunoreactive (IR) hair cells undergoing apoptosis are irregularly shaped and fragmented, detaching from neuromast rosette. e neuromast rosette is more violated and blebs are observed occasionally. f Hair cells are entirely destroyed and those remaining ones are only Casp3 IR. Some separated, shrunken cells are observed (hollow arrow) pointing to advanced apoptosis events. In some cases, 5 mM H2O2 caused neuromast destruction without Casp3 appearance, suggesting that other death pathways may be involved as well (dotted circle) (g). The only centrally located rosette remaining is neuromast innervation (f, g). In 1.5 mM (d) and 2.5 mM (e), H2O2 concentration apoptosis is restricted to the neuromast hair cells, while 5 mM H2O2 exposure leads to other cell types death, e.g., skin cells (g). N = 15/group. Scale bars 20 µm (Color figure online)