
|
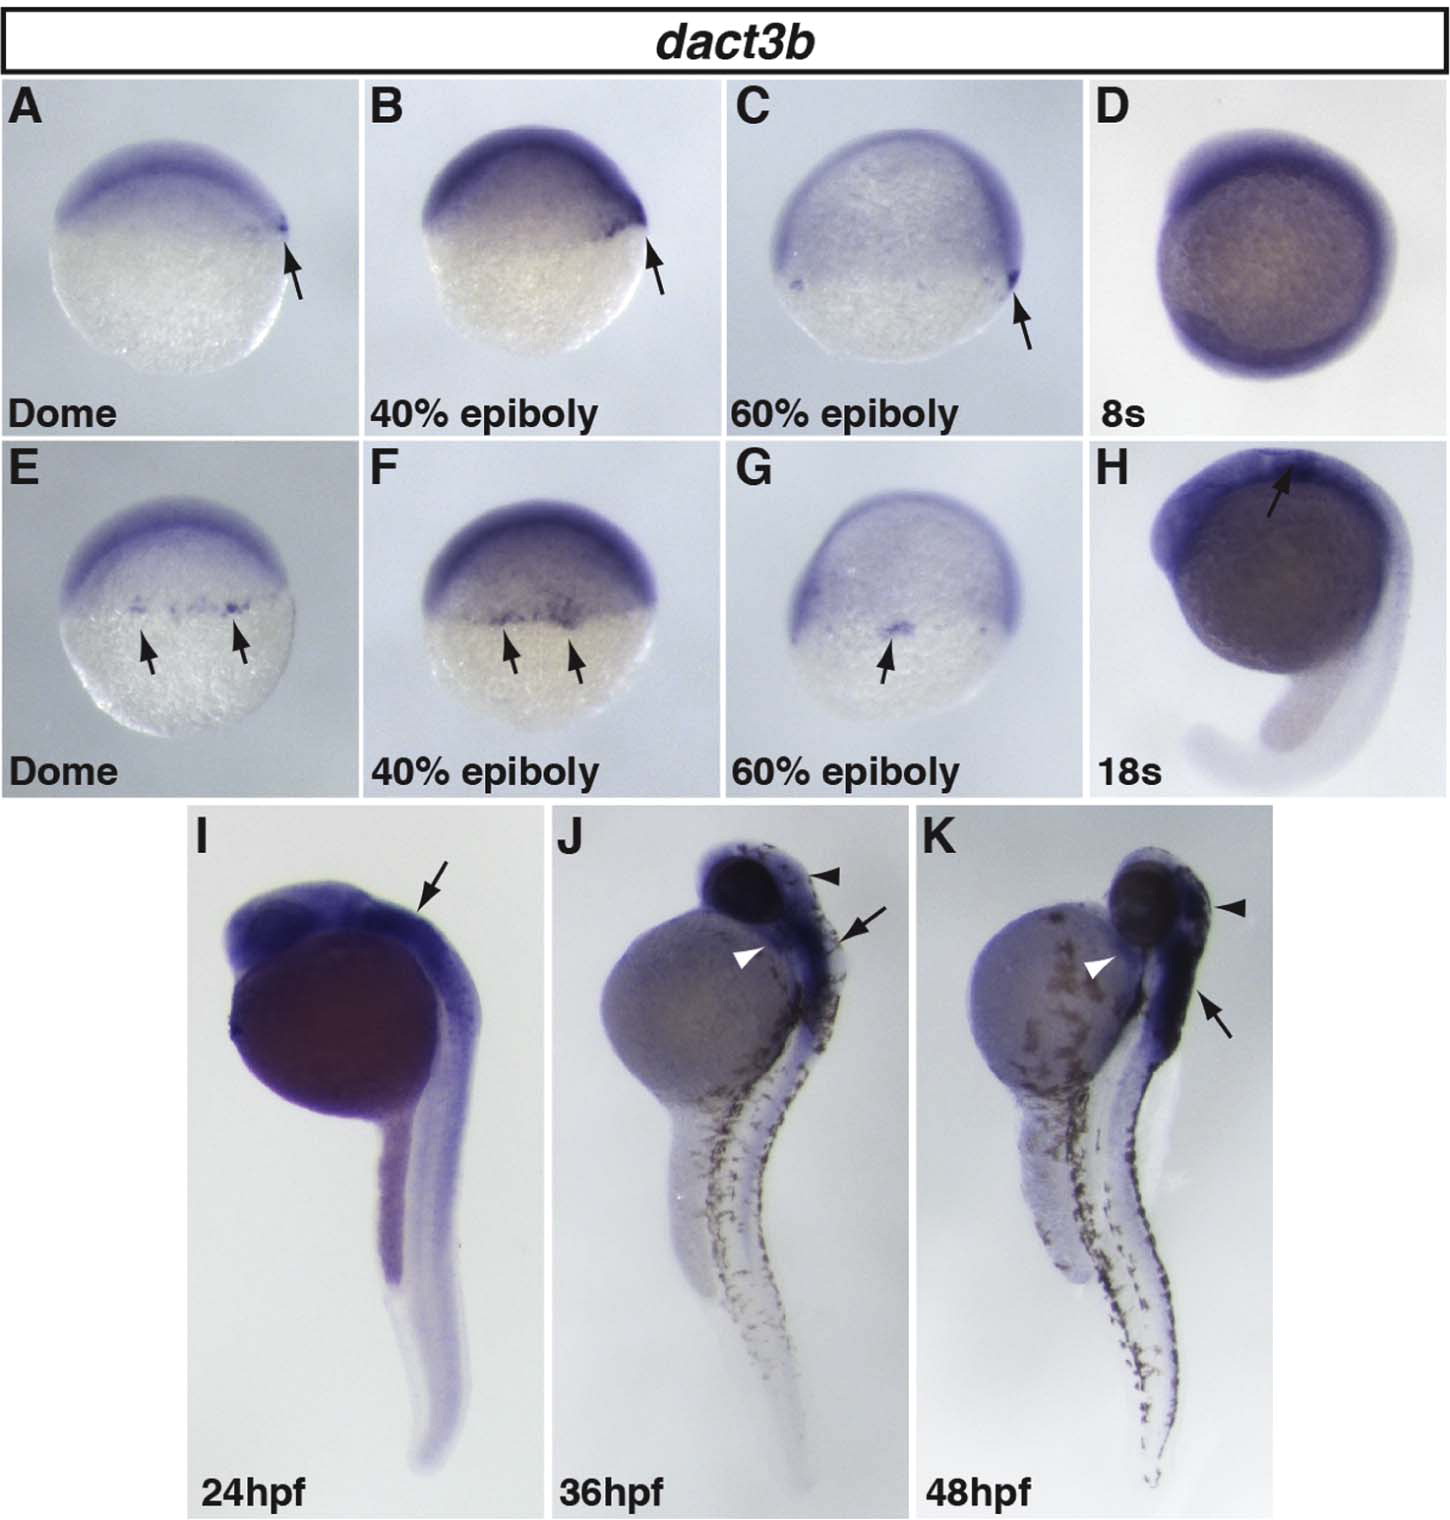
Fig. 6
Zebrafish dact3b expression from dome through 48 hpf. (A-C, E-G) Dact3b expression in the dorsal blastoderm margin from dome through 60% epiboly stage (black arrow). (D) Specific dact3b is not expressed at the 8s stage, even though we could detect it with RT-PCR ( Fig. 3). (H,I) Dact3b expression in the hindbrain starts at 18s and is maintained through 24 hpf embryos (arrow). (J,K) Dact3b expression initiates in the second pharyngeal arch (white arrowheads) and the dorsal region of the midbrain/tectum (black arrowheads) at 36 hpf and is maintained through 48 hpf. Dact3b continues to be expressed in the hindbrain at 36 and 48 hpf (black arrows). A-D and H-K are lateral views with dorsal rightward. E-G are dorsal views. In all images, anterior is up.
Reprinted from Gene expression patterns : GEP, 16(2), Mandal, A., Waxman, J., Retinoic acid negatively regulates dact3b expression in the hindbrain of zebrafish embryos, 122-9, Copyright (2014) with permission from Elsevier. Full text @ Gene Expr. Patterns