
|
Fig. 4 S1
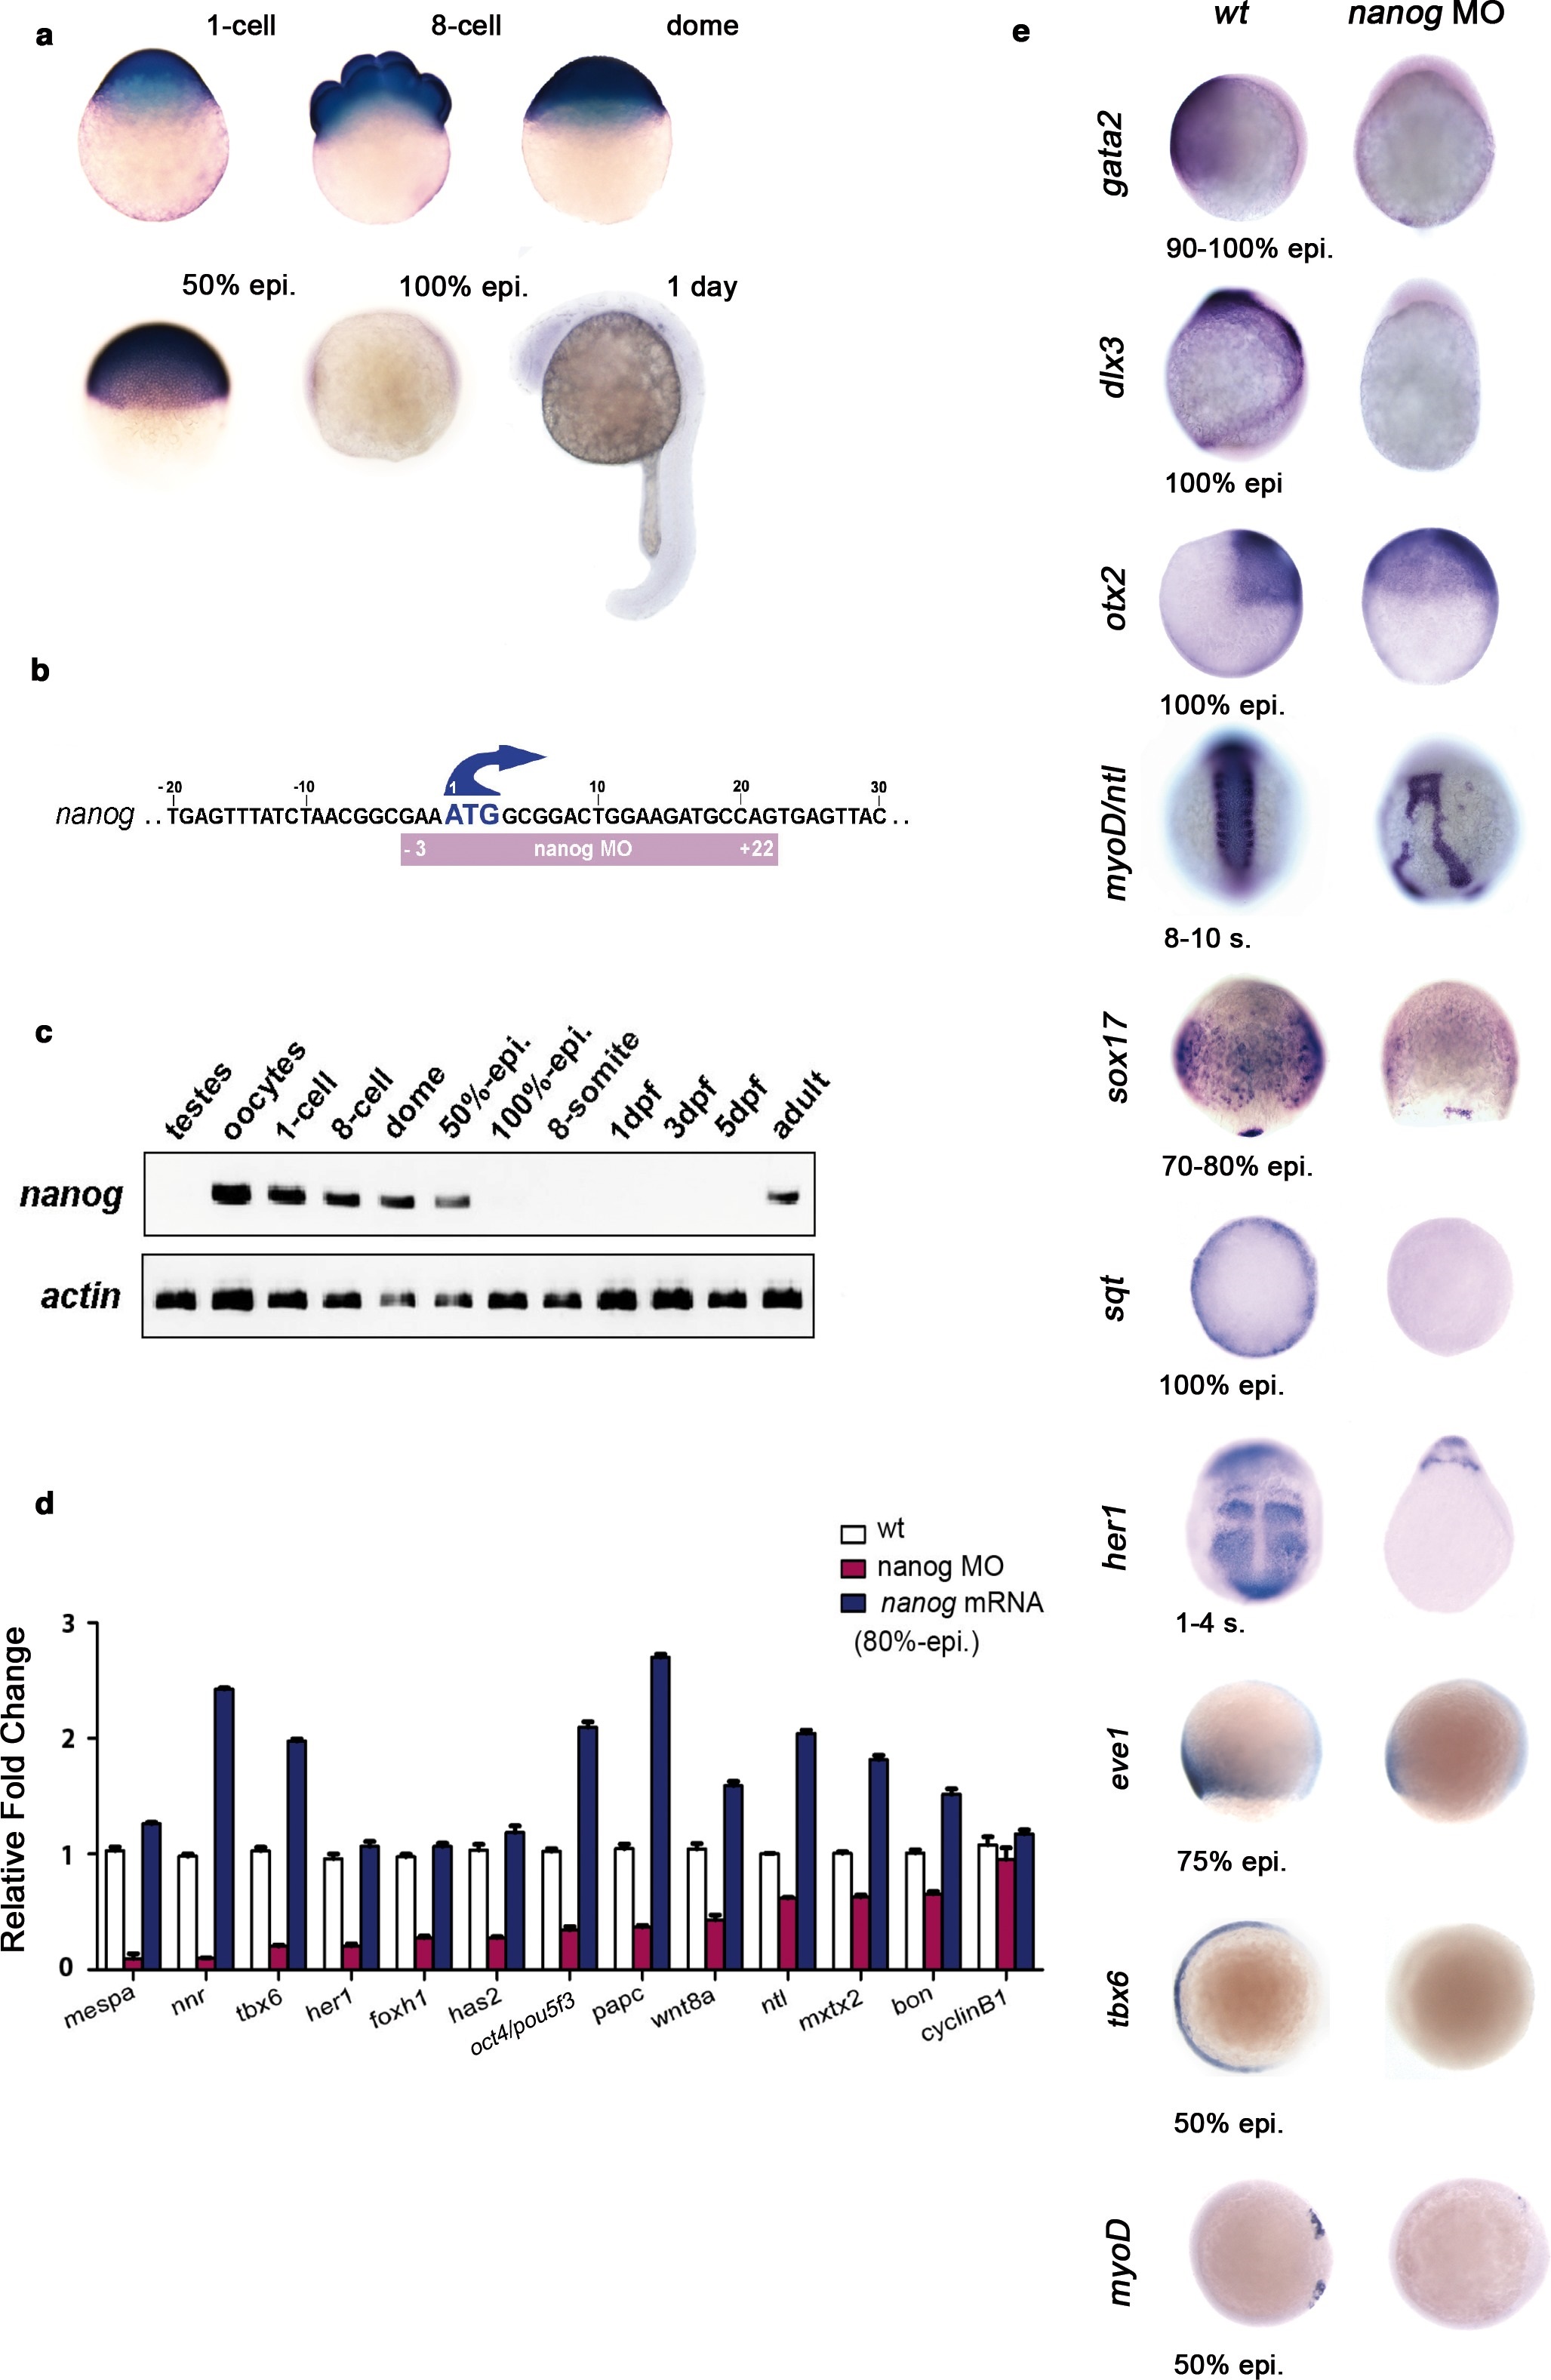
Nanog controls dorsoventral (DV) patterning.
(a) Maternal nanog mRNA is ubiquitously expressed in each blastomere of the eight-cell stage embryo. After mid-blastula transition, nanog expression is uniform in the blastoderm at the dome stage. At 50% epiboly, nanog mRNA is detected in all cells of the blastoderm. nanog mRNA accumulation is minimal by 100% epiboly. At 1 day, nanog transcripts are no longer detected. (b) Position of the nanog ATG-blocking morpholino relative to the translation initiation start of the zebrafish nanog allele. (c) RT-PCR analysis shows that, relative to actin, nanog expression in the developing embryo lasts until the onset of neurulation at early gastrulation, with high maternal contribution in oocytes. (d) qRT-PCR analysis reveals that nanog depletion or overexpression differentially affects the transcription of selected marker genes. Values represent mean ± SE of data from three independent experiments; p<0.01 except for cyclinB1. (e) nanog morphants, relative to wt embryos, lack non-neural ectoderm, as documented by the absence of gata2 expression at the end of gastrulation (88%, n = 52). Similarly, expression of dlx3 is lost in nanog morphants relative to wt embryos (85%, n = 48). Expression of the forebrain-midbrain marker otx2 is radialized in nanog morphants at 100% epiboly relative to wt embryos (95%, n = 41). ntl expression in the dorsal midline and myoD in the somites are mis-localized and absent, respectively, in nanog morphants relative to wt embryos at the 8–10 somite stage (97%, n = 52). The endoderm marker sox17 is dramatically reduced in nanog morphants relative to wt embryos at the mid-gastrula stage (92%, n = 65). sqt expression in the blastoderm margin at 30% epiboly is markedly reduced in nanog morphants relative to wt embryos (94%, n = 39). Presumptive segmental plate expression of her1 at the 1-4 somite stage is lost in nanog morphants relative to wt embryos (95%, n = 45). The ventrolateral mesoderm markers eve1 and tbx6 are reduced and absent, respectively, in nanog morphants relative to wt at 50% epiboly (97%, n = 25; 100%, n = 25).