
Image
|
Figure Caption
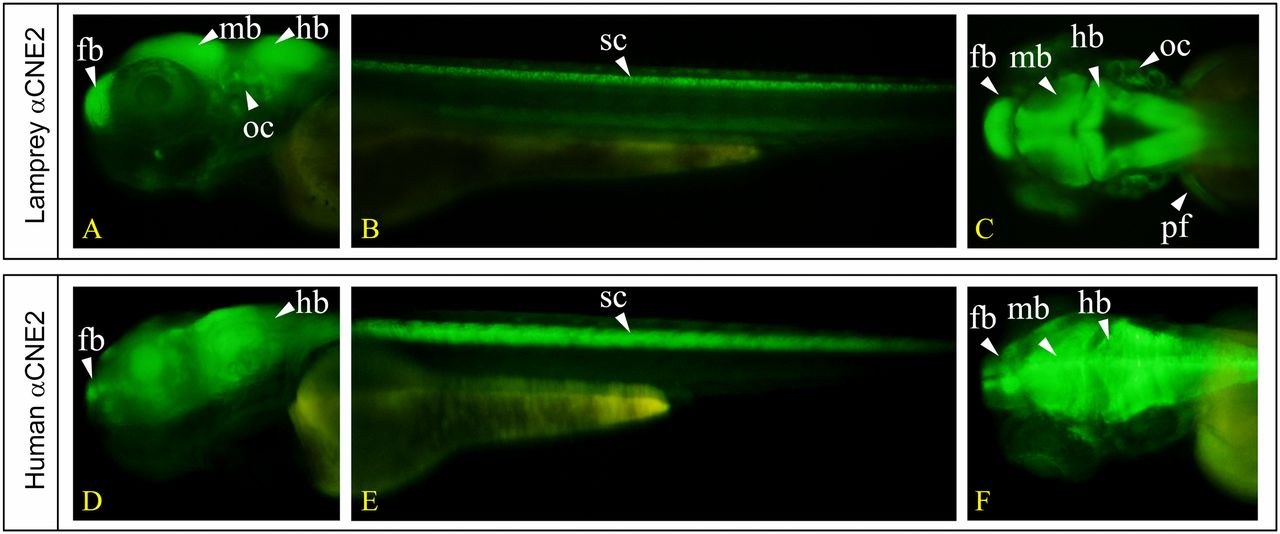
Fig. 2
Expression patterns driven by lamprey Hox-αCNE2 and its human homolog in 3 dpf F1 generation zebrafish embryos. (A, B, D, and E) Lateral views. (C and F) Dorsal views. fb, forebrain; hb, hindbrain; mb, midbrain; oc, otic capsule; pf, pectoral fin; sc, spinal cord.
Figure Data
Acknowledgments
This image is the copyrighted work of the attributed author or publisher, and
ZFIN has permission only to display this image to its users.
Additional permissions should be obtained from the applicable author or publisher of the image.
Full text @ Proc. Natl. Acad. Sci. USA