
Image
|
Figure Caption
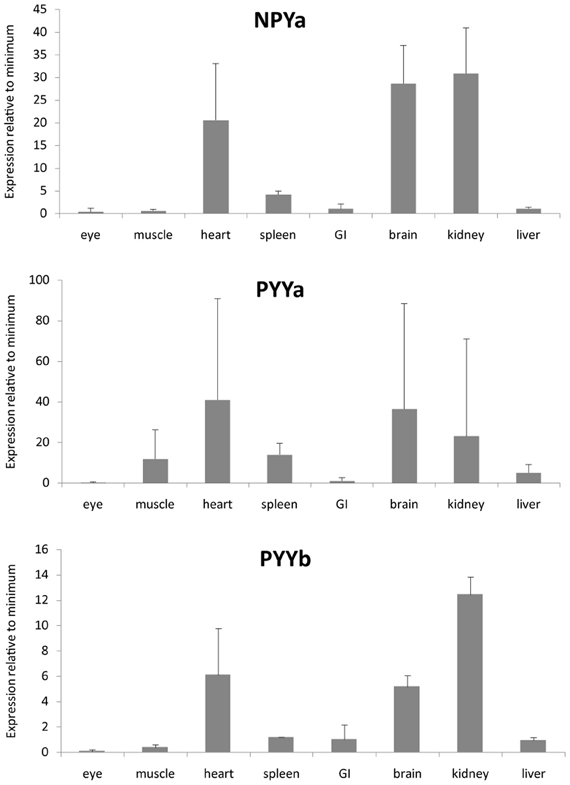
Fig. 3
Expression data for neuropeptide Y peptides in a panel of eight zebrafish organs. Error bars display the standard error of the mean. Normalized Ct values were used to calculate the relative expression values. For each transcript the tissue with the lowest expression was used to calculate relative expression. For all genes, the eye had lowest expression. The analysis was performed twice, each time with duplicate samples.
Figure Data
Acknowledgments
This image is the copyrighted work of the attributed author or publisher, and
ZFIN has permission only to display this image to its users.
Additional permissions should be obtained from the applicable author or publisher of the image.
Full text @ Front. Neurosci.