
Fig. 2
- ID
- ZDB-IMAGE-161101-5
- Genes
- Publication
- Poon et al., 2016 - Development of the cardiac conduction system in zebrafish
- All Figures
- Figures for Poon et al., 2016
|
Fig. 2
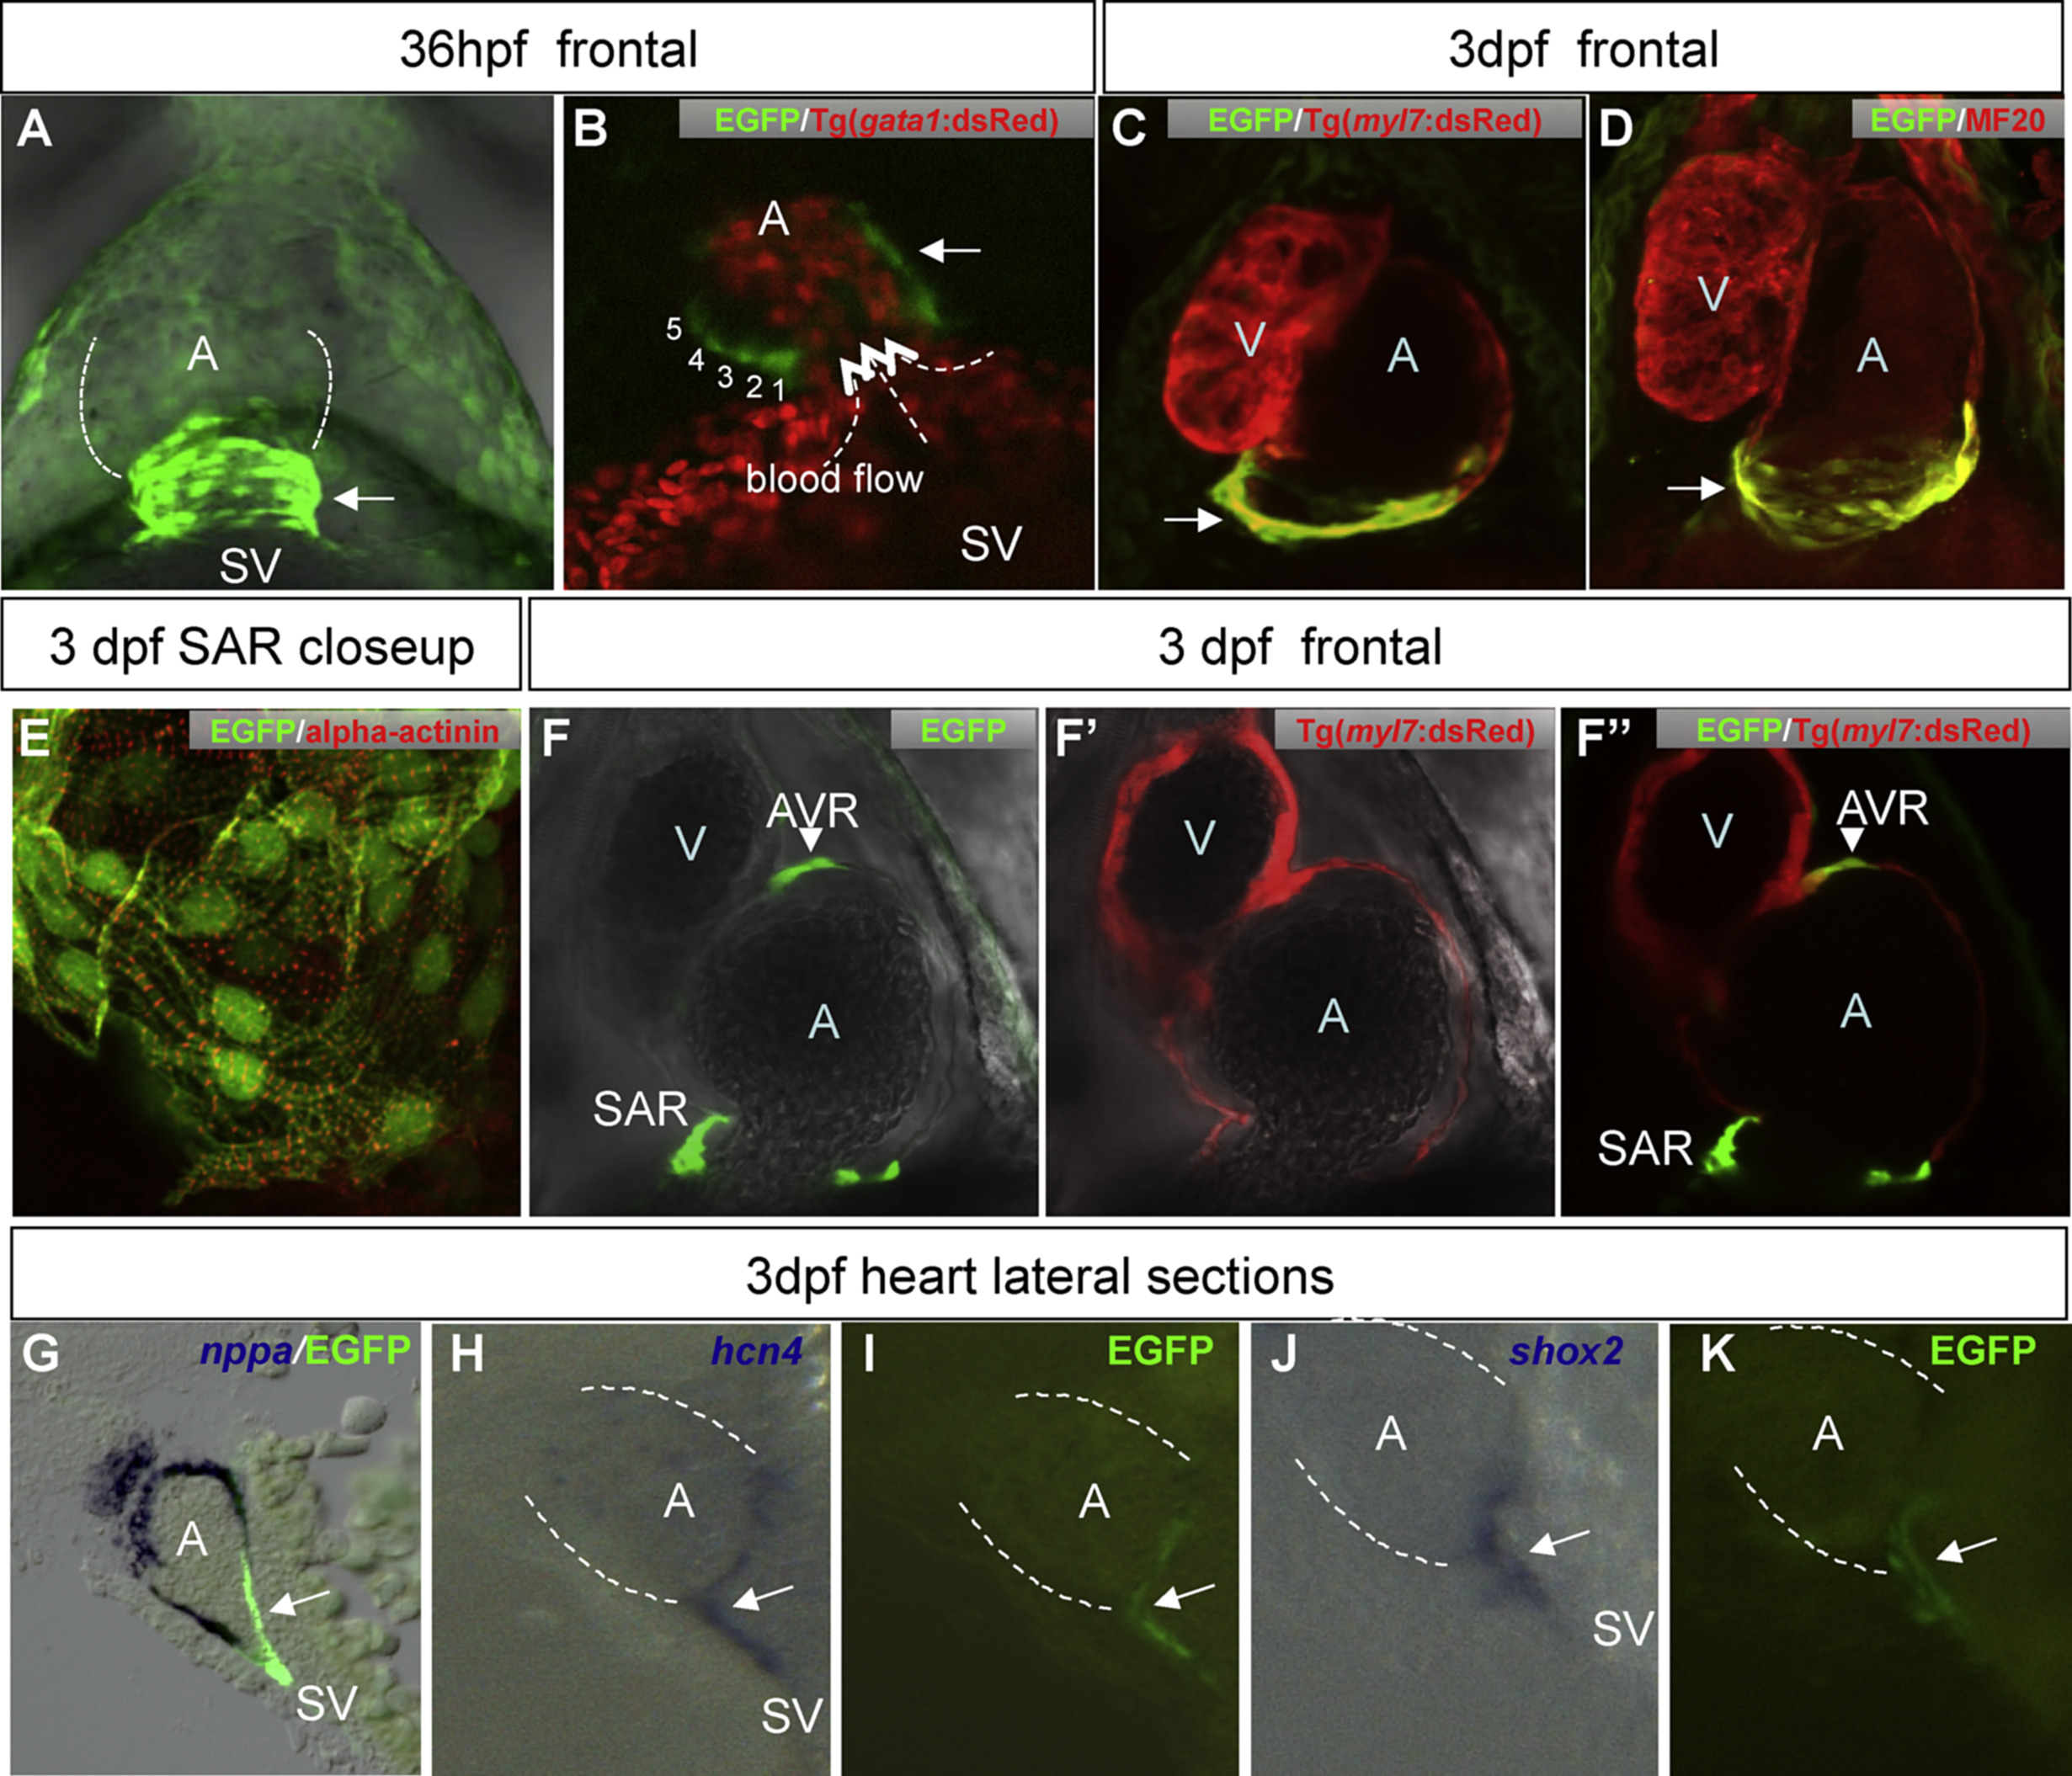
Cardiac EGFP expression in transgenic zebrafish labels the CCS. A: EGFP expression at the venous pole at 36 hpf. sinus venosus(SV) - atrial junction. Numbers indicate rows of EGFP + cells. Dotted arrows indicate direction of blood flow. C-D: Z-stacked confocal images of heart of 3 dpf double transgenic CCS:Tg(myl7:dsRed) (C) and double-labeled EGFP/MF20 (D) shows that the EGFP-positive cells are myocardial in nature. E: EGFP/±-actinin double-labeled EGFP cells at SAR. Image taken at 40× magnifications with 3× digital zoom shows sarcomeric striations (red). F-F′′: Single confocal scan of heart of 3 dpf double transgenic CCS:Tg(myl7:dsRed) shown in EGFP (F), dsRed (F′) and the merged channel (F′′). G: nppa expression does not overlap with the CCS EGFP-signal (sagittal section of 3 dpf heart). H-K: sagittal section of 3 dpf heart of CCS EGFP-positive cells (I,K) co-localize with pacemaker markers hcn4 (H) and shox2 (J). Arrow - SAN EGFP cells, arrowhead - AVC EGFP cells. Dotted white lines in A, H-K outline the atrium. Abbreviations: A, atrium; AVC, atrio-ventricular channel; SAN, sino-atrial node; SV, sinus venosus; V, ventricle.
Reprinted from Gene expression patterns : GEP, 21(2), Poon, K.L., Liebling, M., Kondrychyn, I., Brand, T., Korzh, V., Development of the cardiac conduction system in zebrafish, 89-96, Copyright (2016) with permission from Elsevier. Full text @ Gene Expr. Patterns