
|
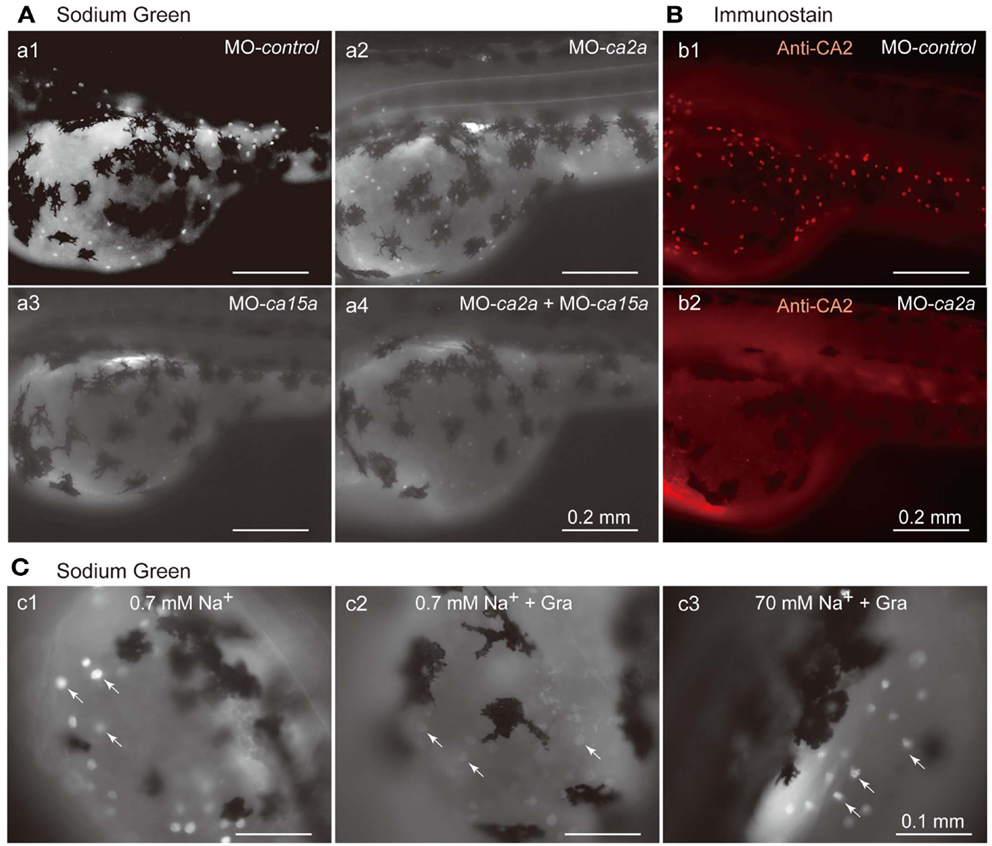
Fig. 4
Inhibitory effects of antisense ca2a and ca15a MOs on Na+ accumulation in MRC. (A) Na+ accumulation was analyzed at 55-hpf by monitoring Sodium Green fluorescence (white spots) in a larva injected with 1 ng each of control-MO (a1), ca2a-MO (a2), ca15a-MO (a3), or ca2a-MO plus ca15a-MO (a4). Endogenous fluorescence from the yolk is seen as a weak background. Relatively strong background on the dorsal area of the yolk is due to the formation of swimbladder, which becomes evident at 55–60 hpf. Large and dendritic dark cells are melanocytes. (B) Confirmation of depletion of the CA2a protein in morphants treated with ca2a-MO. Larvae were treated with control-MO (b1) and ca2a-MO (b2) and stained with anti-CA2a antiserum. (C) Sodium Green fluorescence reflecting intracellular concentrations of Na+. Zebrafish larvae were stained with Sodium Green with or without pretreatment with gramicidin (Gra) in the standard culture medium (c1 and c2) and in a high salt medium (c3). Gramicidin was added to equilibrate the intracellular and extracellular Na+ concentrations.