
Image
|
Figure Caption
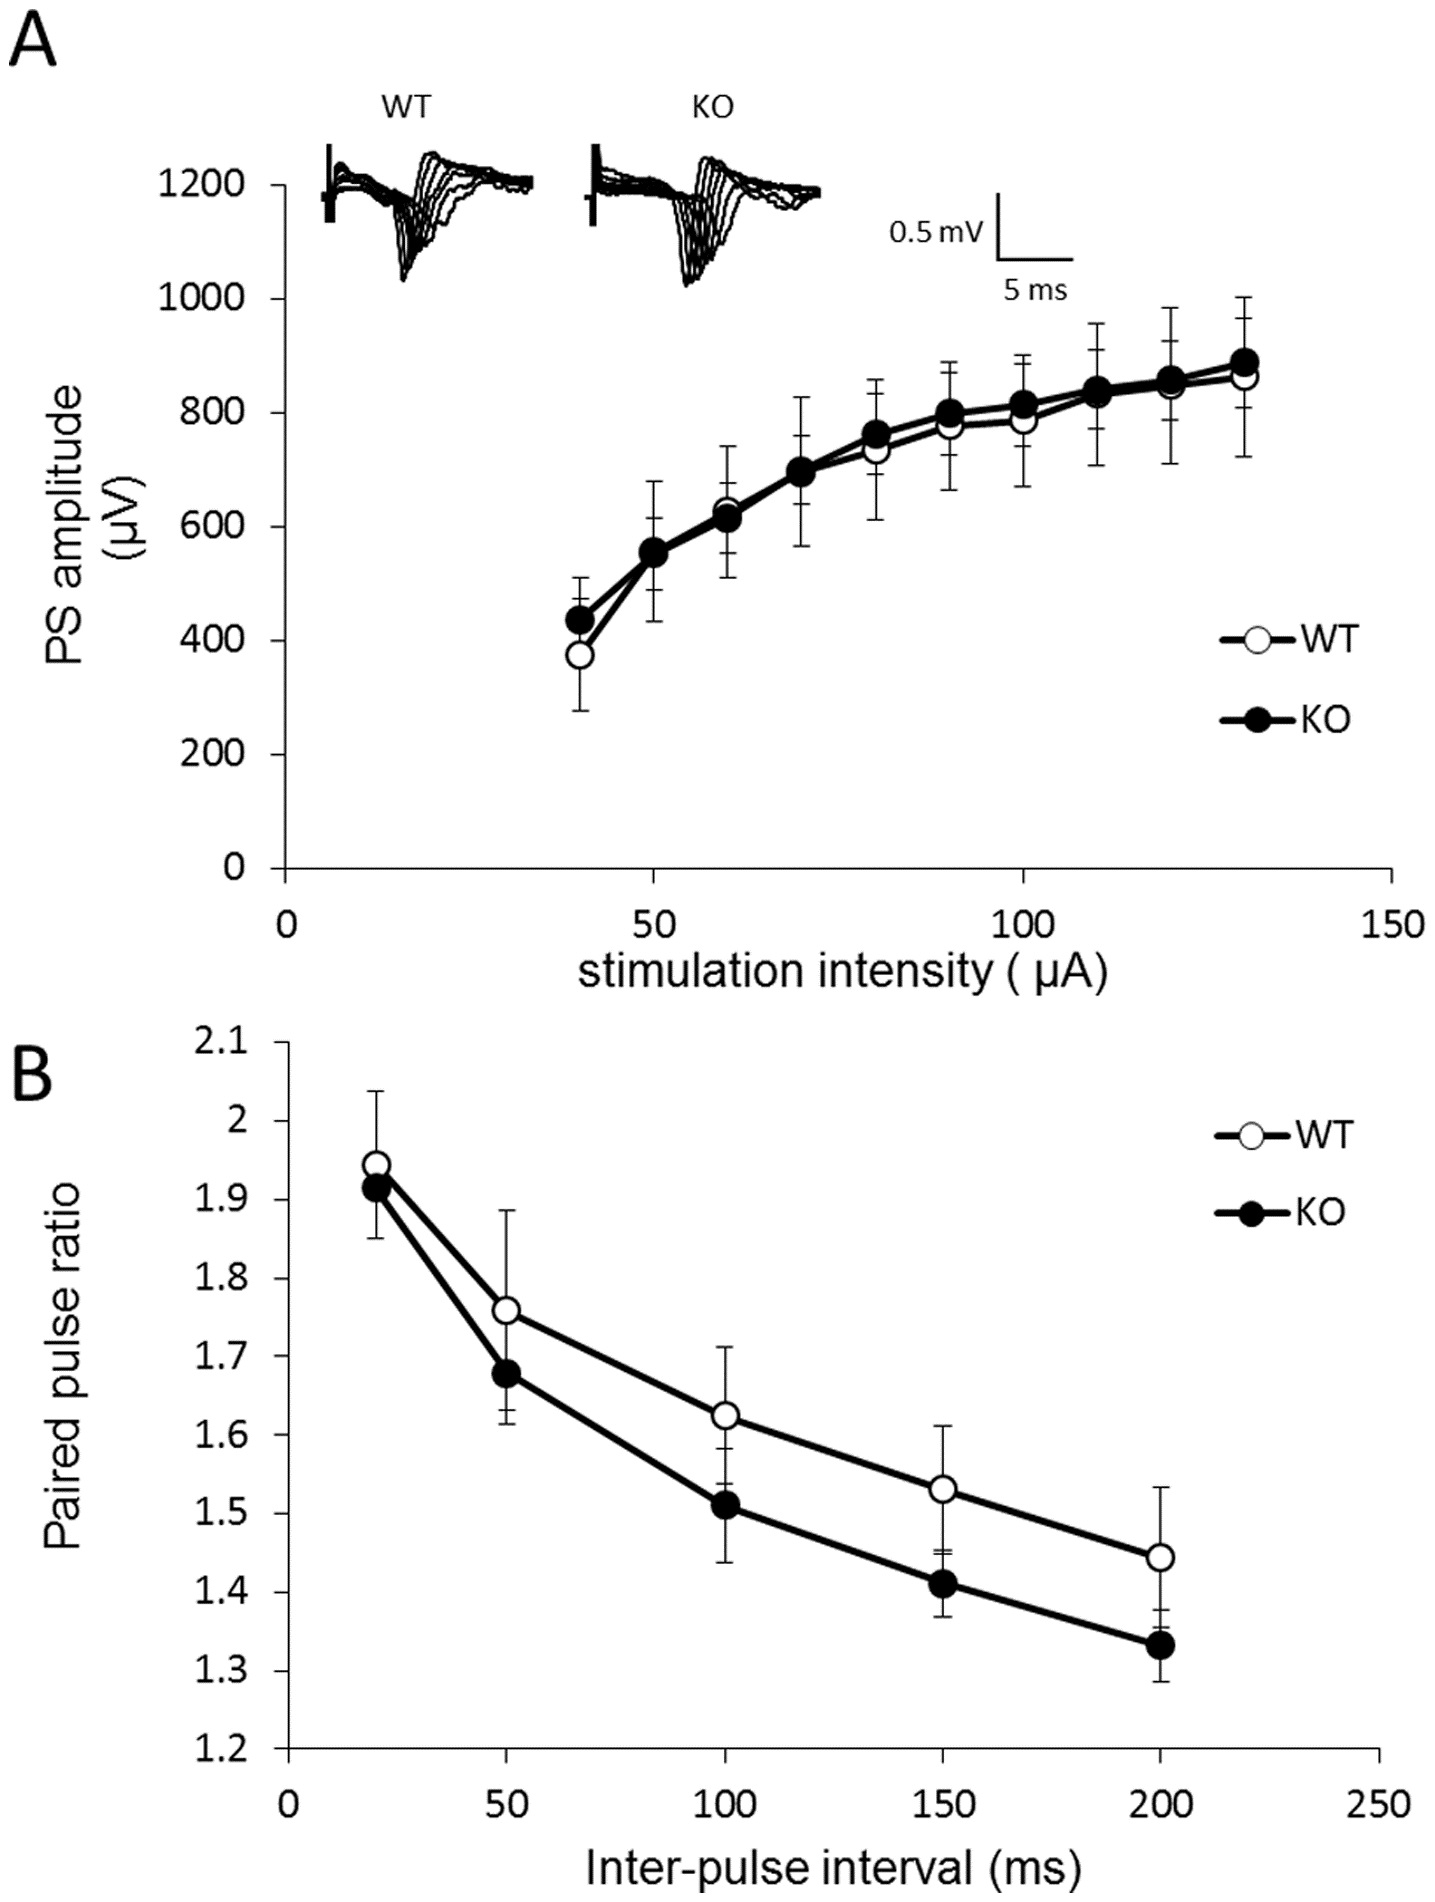
Fig. 5
Basal synaptic function is not different between fmr1 KO and wild-type fish.
(A) Summary of the input-output curves that were created by comparing PS amplitude and stimulus intensity (40-130 µA)(n = 6). (B) Paired-pulse facilitation (FFP) was measured by applying paired stimuli and quantifying the facilitation of the second potential relative to the first as a function of the inter-pulse interval (<200 ms)(n = 7).
Figure Data
Acknowledgments
This image is the copyrighted work of the attributed author or publisher, and
ZFIN has permission only to display this image to its users.
Additional permissions should be obtained from the applicable author or publisher of the image.
Full text @ PLoS One