
|
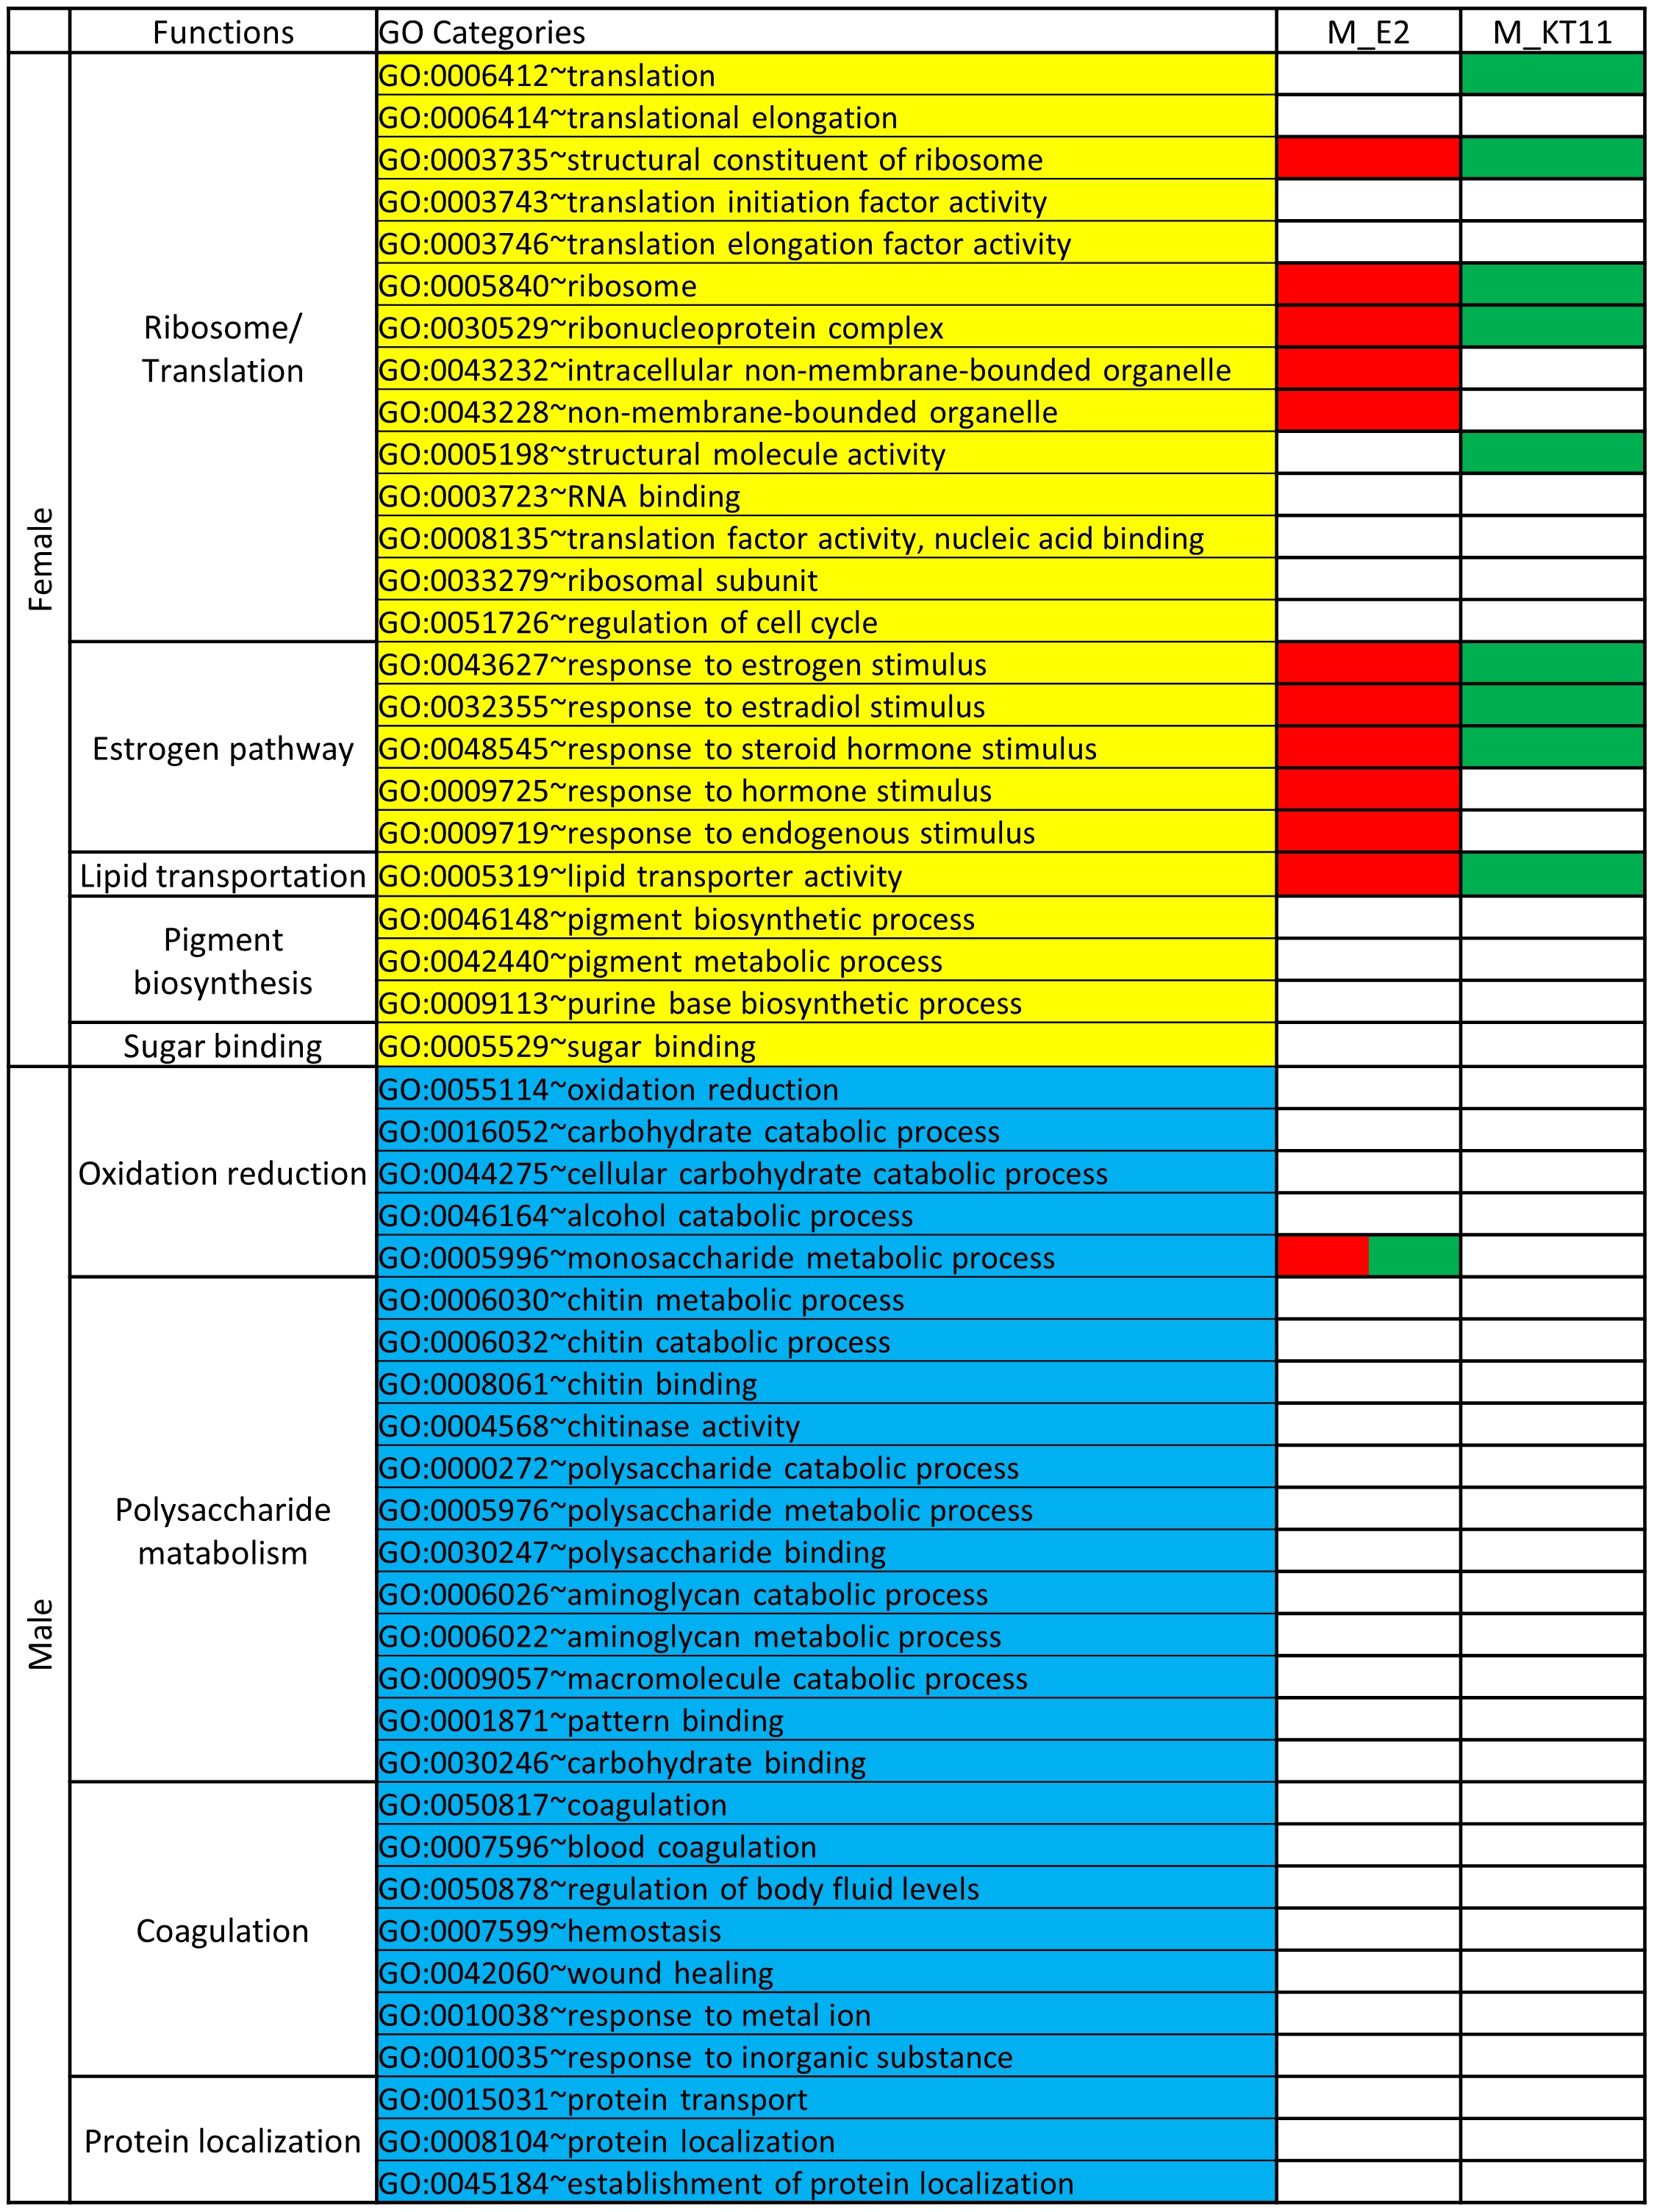
Fig. 5
Changes of sex-biased GO categories in E2- and KT11-treated male zebrafish liver.
Female-biased GO categories are in yellow shade and male-biased GO categories are in blue shade. GO categories under different classification (biological process, molecular function, and cellular component) are combined into functional categories to facilitate the interpretation. Red color represents up-regulation of the GO category and green color represents down-regulation of the GO category. It is clear that most of the female-biased GO categories were up-regulated in E2-treated males and down-regulated in KT11-treated males, while most of the male-biased GO categories were not affected.