
Image
|
Figure Caption
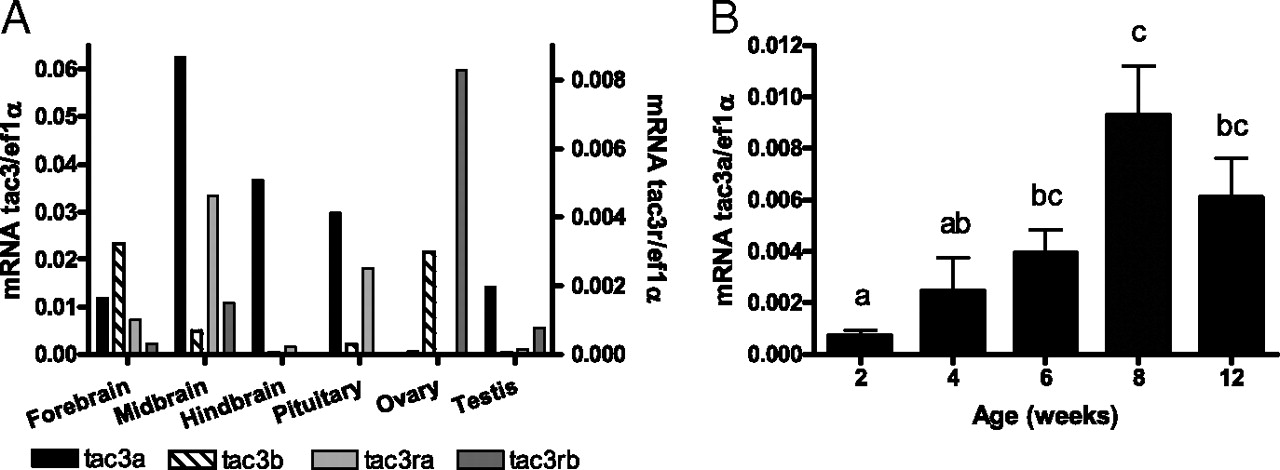
Fig. 2
Expression of zebrafish tac3a, tac3b, tac3ra, or tac3rb mRNA in various parts of the brain (A) and changes in zebrafish tac3a at various ages toward puberty (B) as determined by real-time PCR. The relative abundance of the mRNAs was normalized to the amount of elongation factor 1 α (ef1α) by the comparative threshold cycle method; the comparative threshold reflects the relative amount of the transcript. Results are means ± SEM (n = 11-15). Means marked with different letters differ significantly (P < 0.05).
Figure Data
Acknowledgments
This image is the copyrighted work of the attributed author or publisher, and
ZFIN has permission only to display this image to its users.
Additional permissions should be obtained from the applicable author or publisher of the image.
Full text @ Proc. Natl. Acad. Sci. USA