
Image
|
Figure Caption
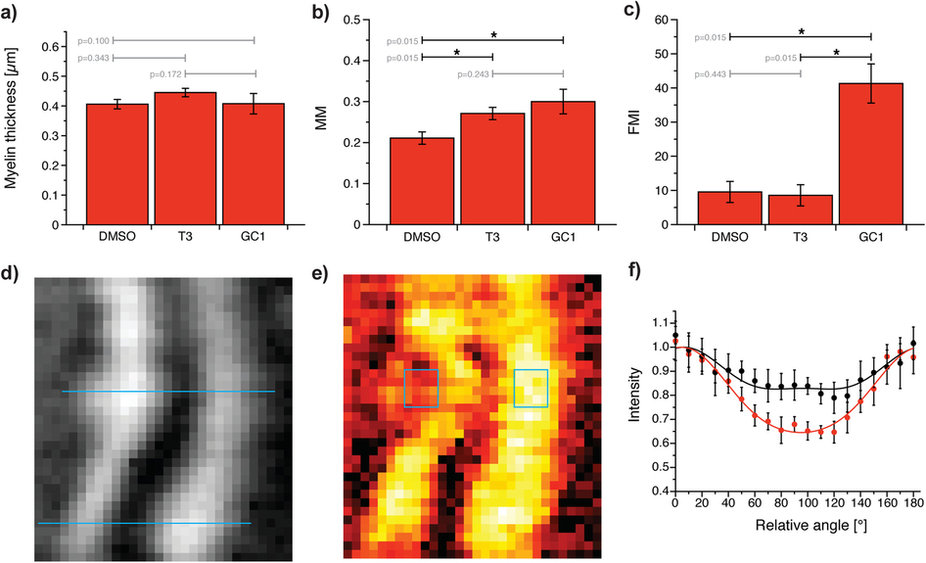
Fig. 2
Evaluation of promyelination chemical treatments.
(a) The myelin thickness, (b) the MM, and (c) the focal myelination index (FMI) as a function of chemical treatments (Mann-Whitney test, n = 4). (d) CARS image of a Mauthner axon in a GC1-treated zebrafish. (d) Mapping of the MM from P-CARS reveals a discontinuity on the left side. Blue ROIs indicate where the polarization dependence is plot in (f). The black curve is from the focal myelin discontinuity (e-left, MM = 0.17 ± 0.04) and the red curve from the normal region (e-right, MM = 0.34 ± 0.03).
Acknowledgments
This image is the copyrighted work of the attributed author or publisher, and
ZFIN has permission only to display this image to its users.
Additional permissions should be obtained from the applicable author or publisher of the image.
Full text @ Sci. Rep.