
|
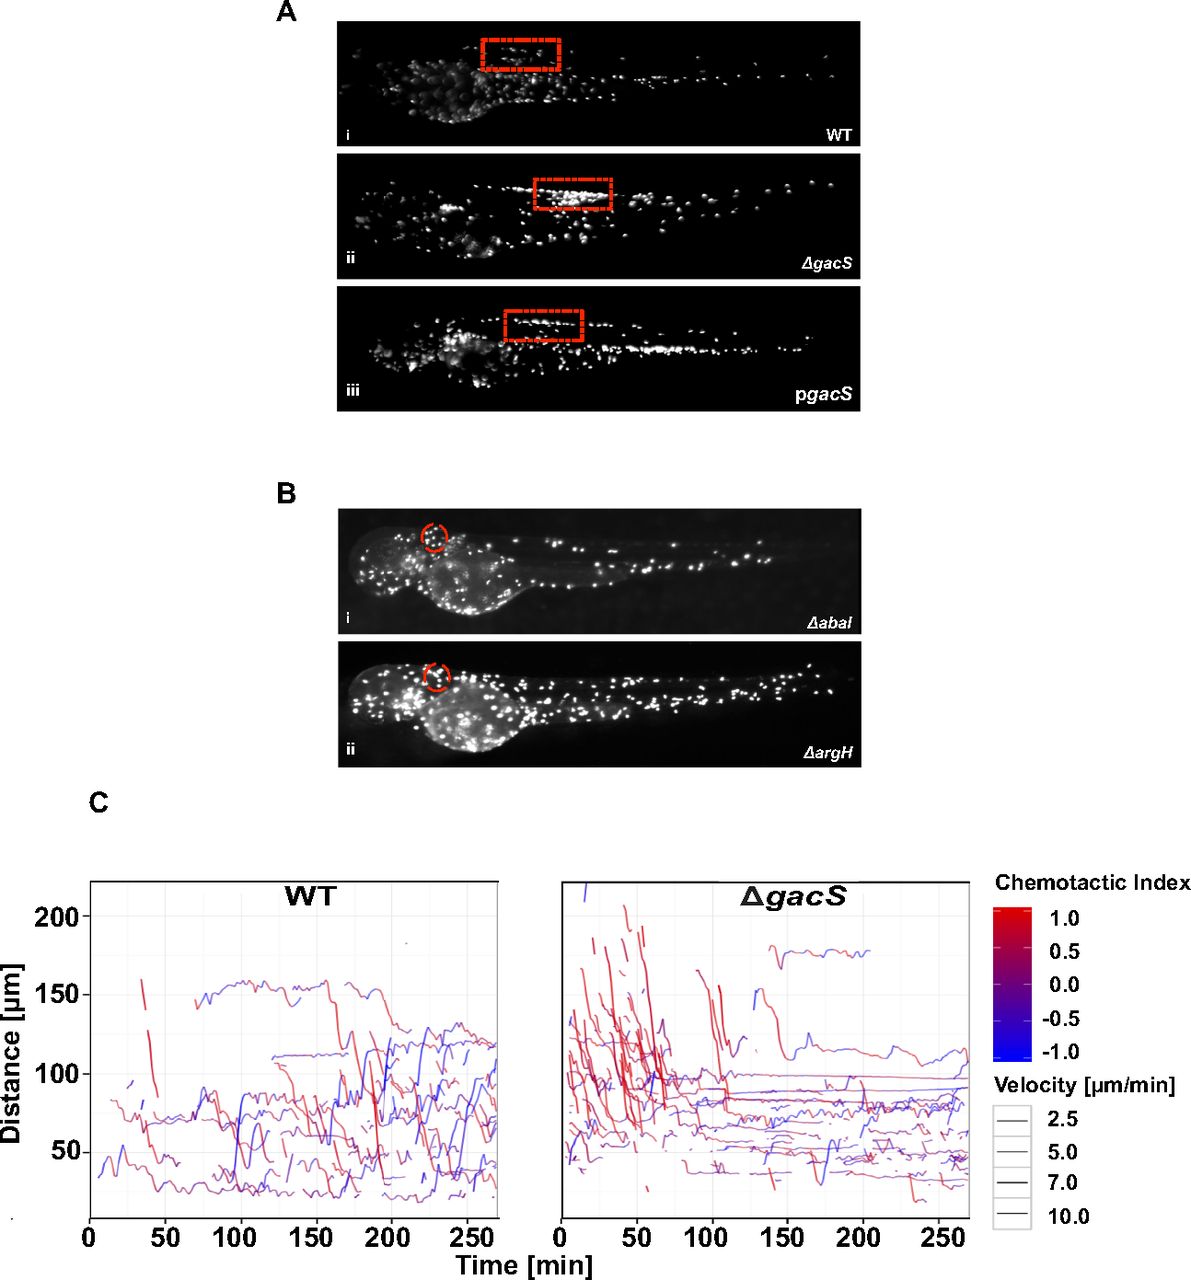
Fig. S3
(A) Localized somatic muscle infection (red rectangle) imaged at 48 hpi with wild-type A. baumannii (ATCC 17978) (i), ΔgacS (ii), and the complemented strain (pgacS) (iii). (B) Infection into the otic vesicle (red circle) with A. baumannii ΔargH and ΔabaI at 48 hpi showing no evidence of neutrophil clustering. (C) Cell-tracking analysis of neutrophil movement after infection with WT and ΔgacS strains. A chemotactic index (red, movement toward infection; blue, movement away) and velocity (thickness of the line) are indicated (representative experiment from five biological replicates). This image is an enlarged version of Fig. 4D for a clearer view of the cell-tracking analysis. (Magnification: 10×.)