
|
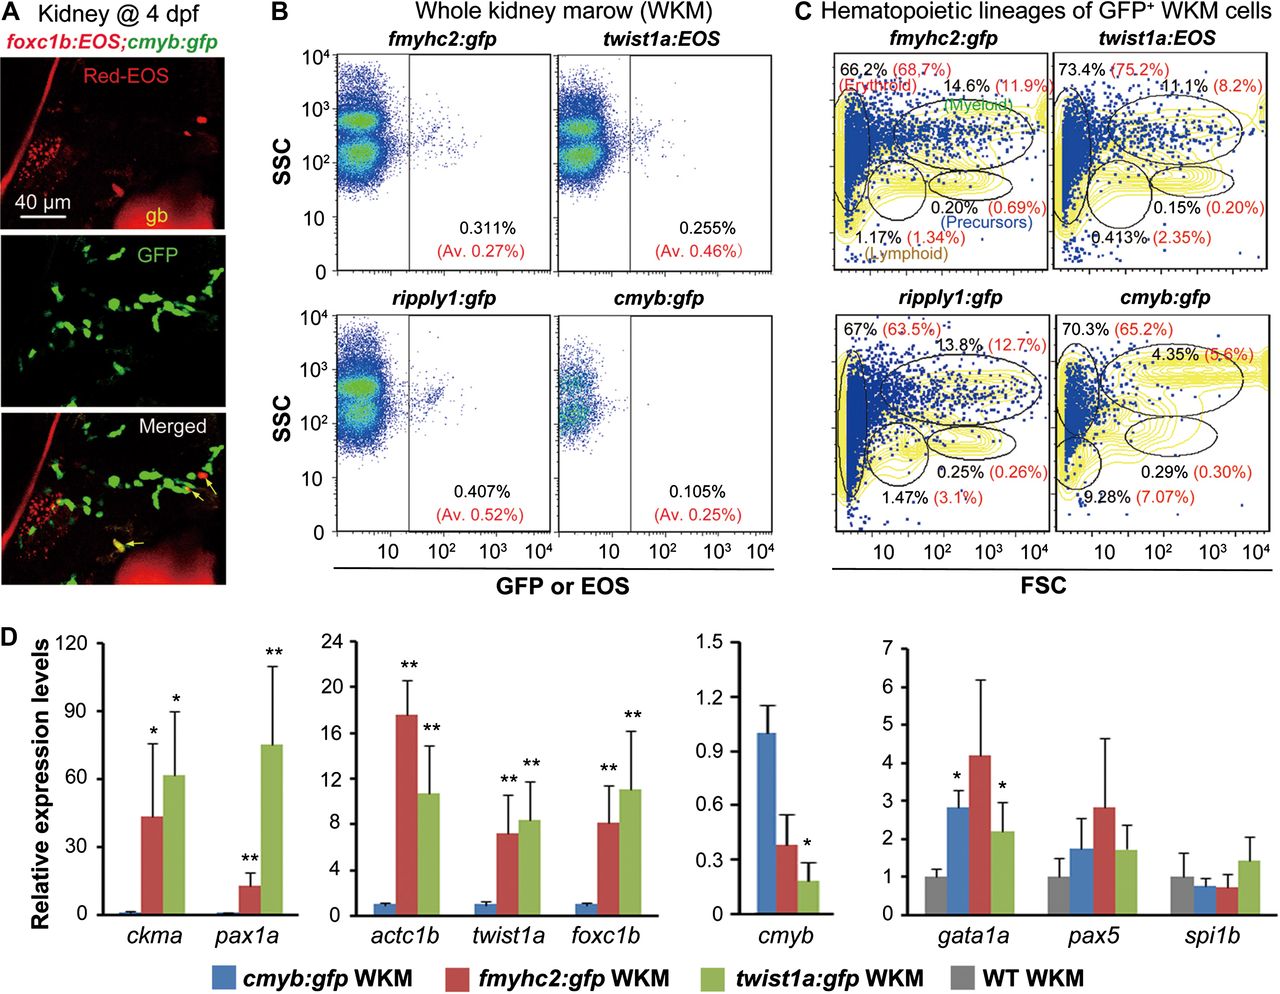
Fig. 6
Analysis of sHPSCs in larvae and adults. (A) Co-colonization of foxc1+ sHPSCs (indicated by arrows) with cmyb+ HSCs in the kidney of a Tg(foxc1b:EOS;cmyb:gfp) transgenic larva, which was photoactivated in five pairs of posterior somites at the 25s stage. gb, gall bladder with red autofluorescence. (B) Detection of sPHSCs by flow cytometry in adult (3–6 months old) kidney marrow of various transgenic lines. The representative result was shown for one fish, and the average ratio (Av.) of EOS+ or GFP+ sHPSCs from three fish was indicated in parenthesis. (C) EOS+ or GFP+ sHPSCs sorted from the adult kidney marrow of a representative fish in various transgenic lines were re-analyzed by forward and side scatter. Different scatter fractions were circled with indicated percentage of cells. The yellowed area represented the sorting result of the WKM. The average percentage from three analyzed fish was written in red. (D) Expression levels of a set of muscle/skeletal or hematopoietic marker genes in twist1a+ or fmyhc2+ sHPSCs were analyzed by qRT-PCR compared to cmyb+ hematopoietic cells. GFP+ cells were sorted from the kidney marrow of corresponding transgenic adult fish. Data were shown as means from three experiments with the error bar indicated. *P < 0.05; **P < 0.01.