
|
Fig. 6
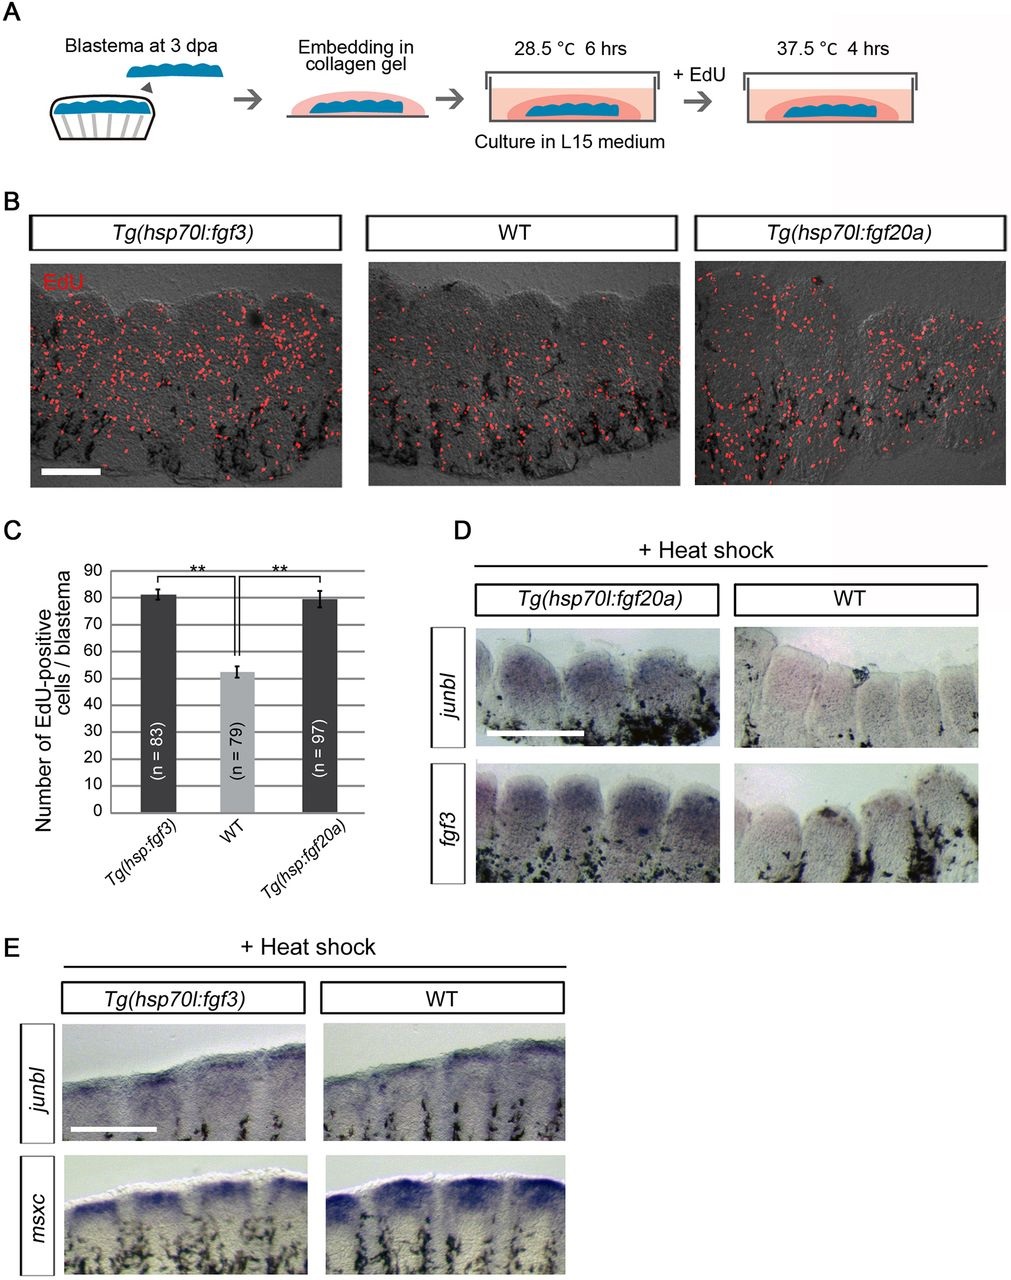
Expression of fgf3 promotes proliferation of blastema cells. (A) The cell proliferation assay procedure using a blastema explant. (B) EdU incorporation in the blastema explants from Tg overexpressing fgf3 or fgf20a, and wild-type (WT) zebrafish. EdU was applied for 6h before sampling. A significant increase in the number of EdU-positive cells in the fgf3- and fgf20a-overexpressing explants was observed. (C) Quantification of EdU incorporation in the explants. Error bars represent mean±s.e.m. Student′s t-test was performed to assess statistical significance. **P<0.01. n, the number of blastema, which were taken from six WT fish, six Tg(hsp70l:fgf3) or eight Tg(hsp70l:fgf20a). (D) Whole-mount ISH analysis of junbl and fgf3 in fgf20a-expressing and WT explants after 20h at 28.5°C plus 4h at 37.5°C. A significant increase of junbl (n=5/5 explants) or fgf3 (n=5/5 explants) was observed. It is thought that the induction of fgf3 expression by Fgf20a activated cell proliferation. (E) Whole-mount ISH analysis of msxc and junbl in fgf3-expressing and WT fins at 4dpa. Unlike the fgf20a-overexpressing fins (Fig. 5), the fgf3-overexpressing fins did not show an increase in expression of msxc (n=6/6) or junbl (n=6/6). Scale bars: 100µm (B); 200µm (D,E).