
|
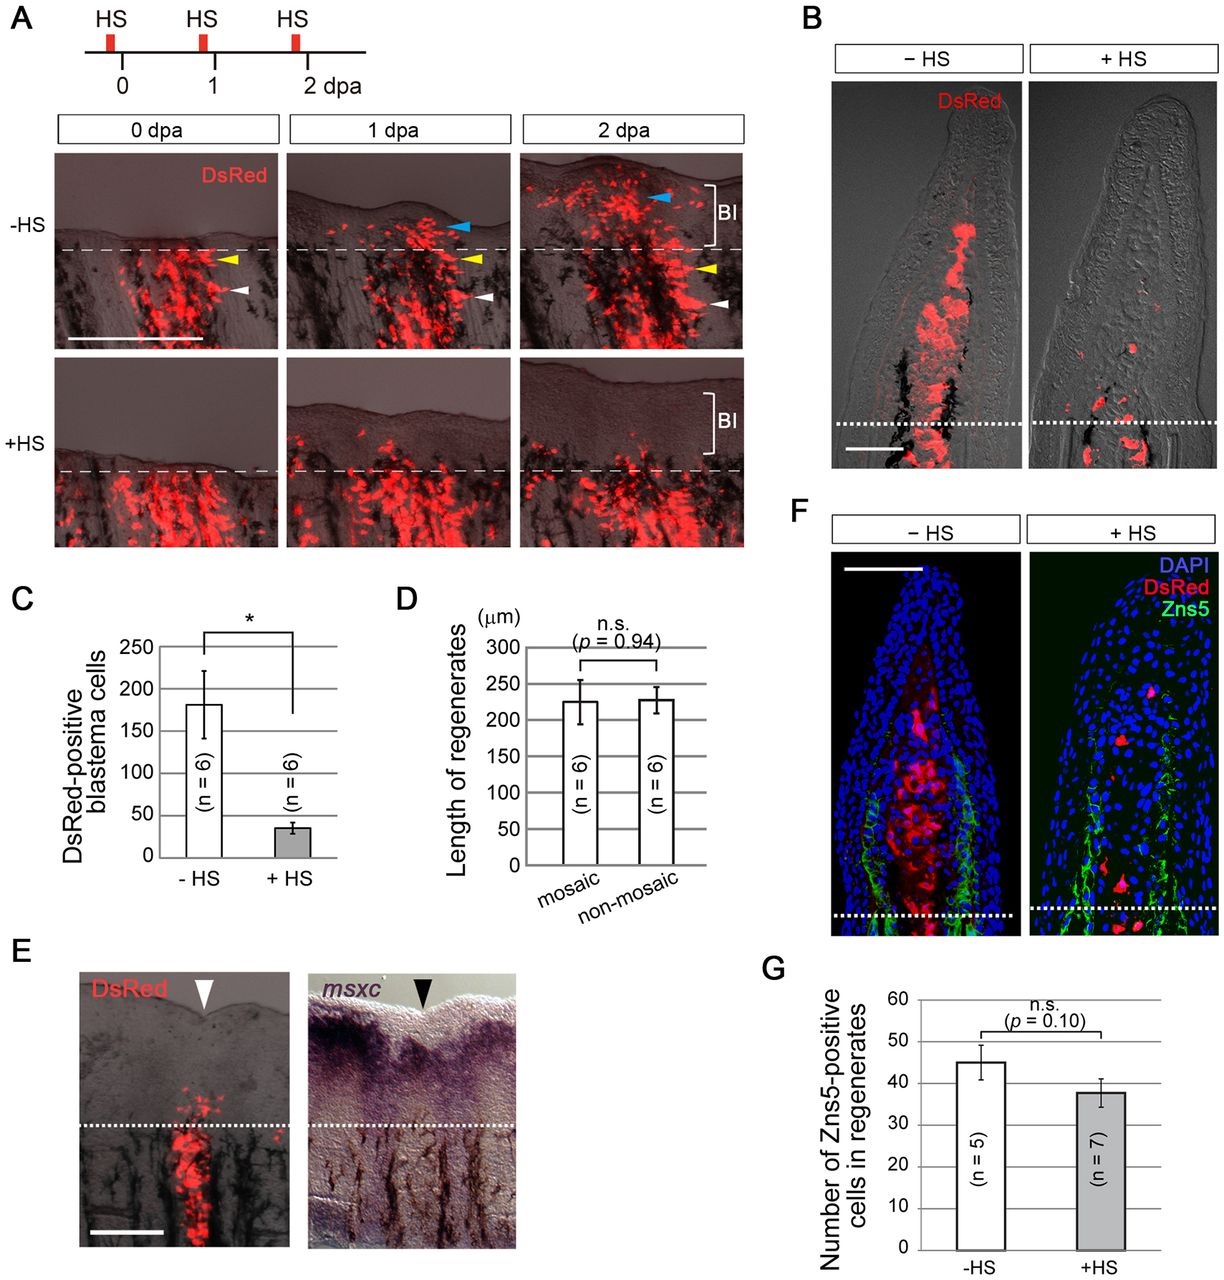
Fig. 3
Action of early Fgf signalling on mesenchymal cells induces blastema formation. (A) Tracking of the behaviour of labelled mesenchymal cells from 0 to 2dpa. With intact Fgf signalling, numerous DsRed2-positive mesenchymal cells migrated in the distal direction and contributed to the blastema (HS; 7/7 successful transplants), but few Fgf non-responsive cells participated in blastema formation (+HS; 8/8 successful transplants). Bl, blastema. Dashed lines, site of amputation. The coloured arrowheads respectively indicate the corresponding cell populations between different regeneration stages. (B) Tissue sections of representative samples at 2dpa. In the absence of heat shock (HS), progenies of the transplanted cells contributed to the blastema. By contrast, after heat shock the Fgf non-responsive cells stayed near the amputation plane (+HS). Dotted lines, site of amputation. (C) Quantification of the DsRed2-positive cells in the blastema in the presence (+HS) or absence (HS) of heat shock. n, the number of fin rays that successfully contained many DsRed2-positive mesenchymal cells and were used for quantification (five fish in total, respectively). *P<0.02. (D) Measurement of the length of regenerates of mosaic or non-mosaic fin rays. The heat shock was applied daily, and the lengths of the regenerates were measured at 2dpa. No significant differences were observed in spite of the impaired contribution of Fgf non-responsive cells in the mosaic fin rays. n, the number of fin rays that successfully contained many DsRed2-positive mesenchymal cells and were used for quantification (five fish in total, respectively). (E) Expression of msxc in the mosaic fin. msxc expression was nearly normal at 2dpa in the mosaic regenerate in spite of the reduced contribution of the Fgf non-responsive cells to the blastema (n=5/5 successful transplants). Black and white arrowheads indicate the mosaic fin ray. Dotted lines, site of amputation. (F) Distribution of osteoblasts detected by the anti-Zns5 antibody in the mosaic regenerate at 2dpa. The distribution of osteoblasts was not affected in spite of the impaired contribution of Fgf non-responsive cells in the mosaic fin rays. Dotted line, site of amputation. (G) Quantification of the Zns5-positive cells shown in F. n=the number of sections used for the quantification, which were derived from four independent transplantations. In C,D,G, error bars denote mean±s.e.m.; Student′s t-test was performed to assess statistical significance. n.s., not significant. Scale bars: 200µm (A,E); 50µm (B,F).