
|
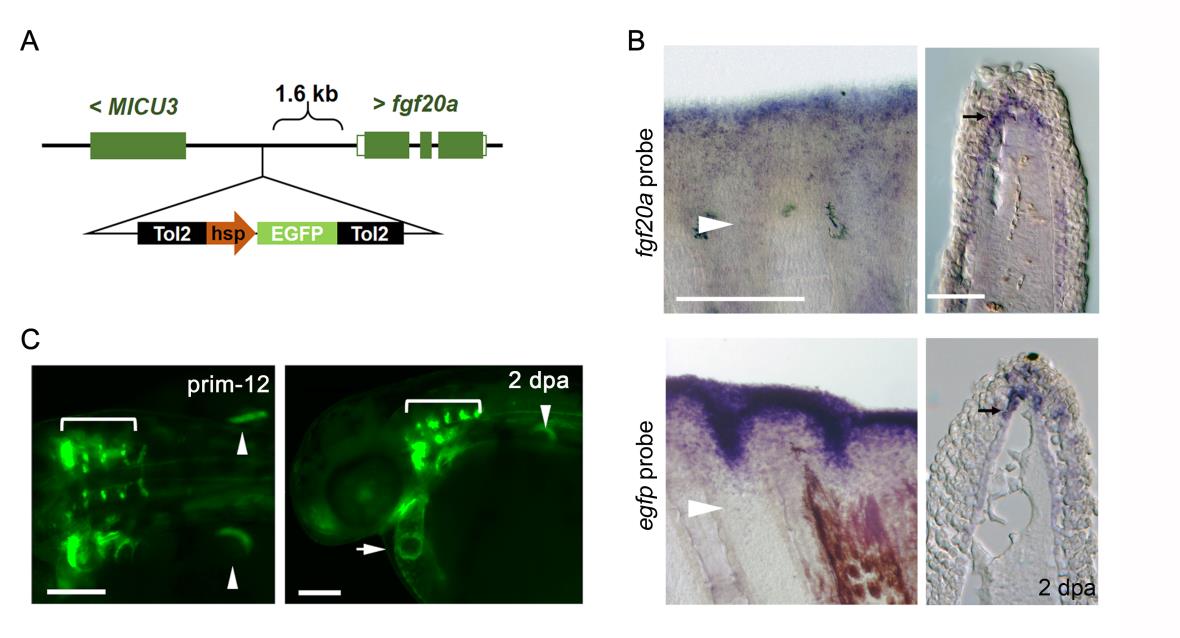
Fig. S4
Recapitulation of fgf20a expression in an enhancer trap zebrafish transgenic (Tg) line, HGn21A. (A) A map of the genomic region where the enhanced green fluorescent protein (EGFP) cassette is inserted in the enhancer trap line HGn21A. The EGFP cassette containing the heat shock protein 70l basal promoter (hsp) and flanking Tol2 sequences was inserted into the site 1.6 kb upstream of fgf20a in zebrafish chromosome 1. Micu3, mitochondrial calcium uptake family member 3. (B) In situ hybridisation (ISH) analysis of fgf20a expression (upper panels) and EGFP expression (lower panels) in HGn21A zebrafish. The corresponding tissue sections, which were prepared after the whole-mount ISH, are shown on the right. Both signals were detected in the basal layer of the wound epidermis (arrows). Arrowheads, the site of amputation. Scale bars, 200 mm for the whole-mount analysis and 50 mm for the tissue sections. (C) EGFP fluorescence at the prim-12 stage in HGn21A zebrafish. Besides the expression in the rhombomere neurons (Terriente et al., 2012), embryonic EGFP expression was detected in tissues such as the heart primordium (arrow) and pectoral fin buds (arrowheads). A dorsal view (left panels) and lateral view (right-hand panels). Arrowheads, the pectoral-fin primordium; arrow, the developing heart; brackets, rhombomere neurons in the hindbrain. Scale bars, 50 µm.