
|
Fig. 3
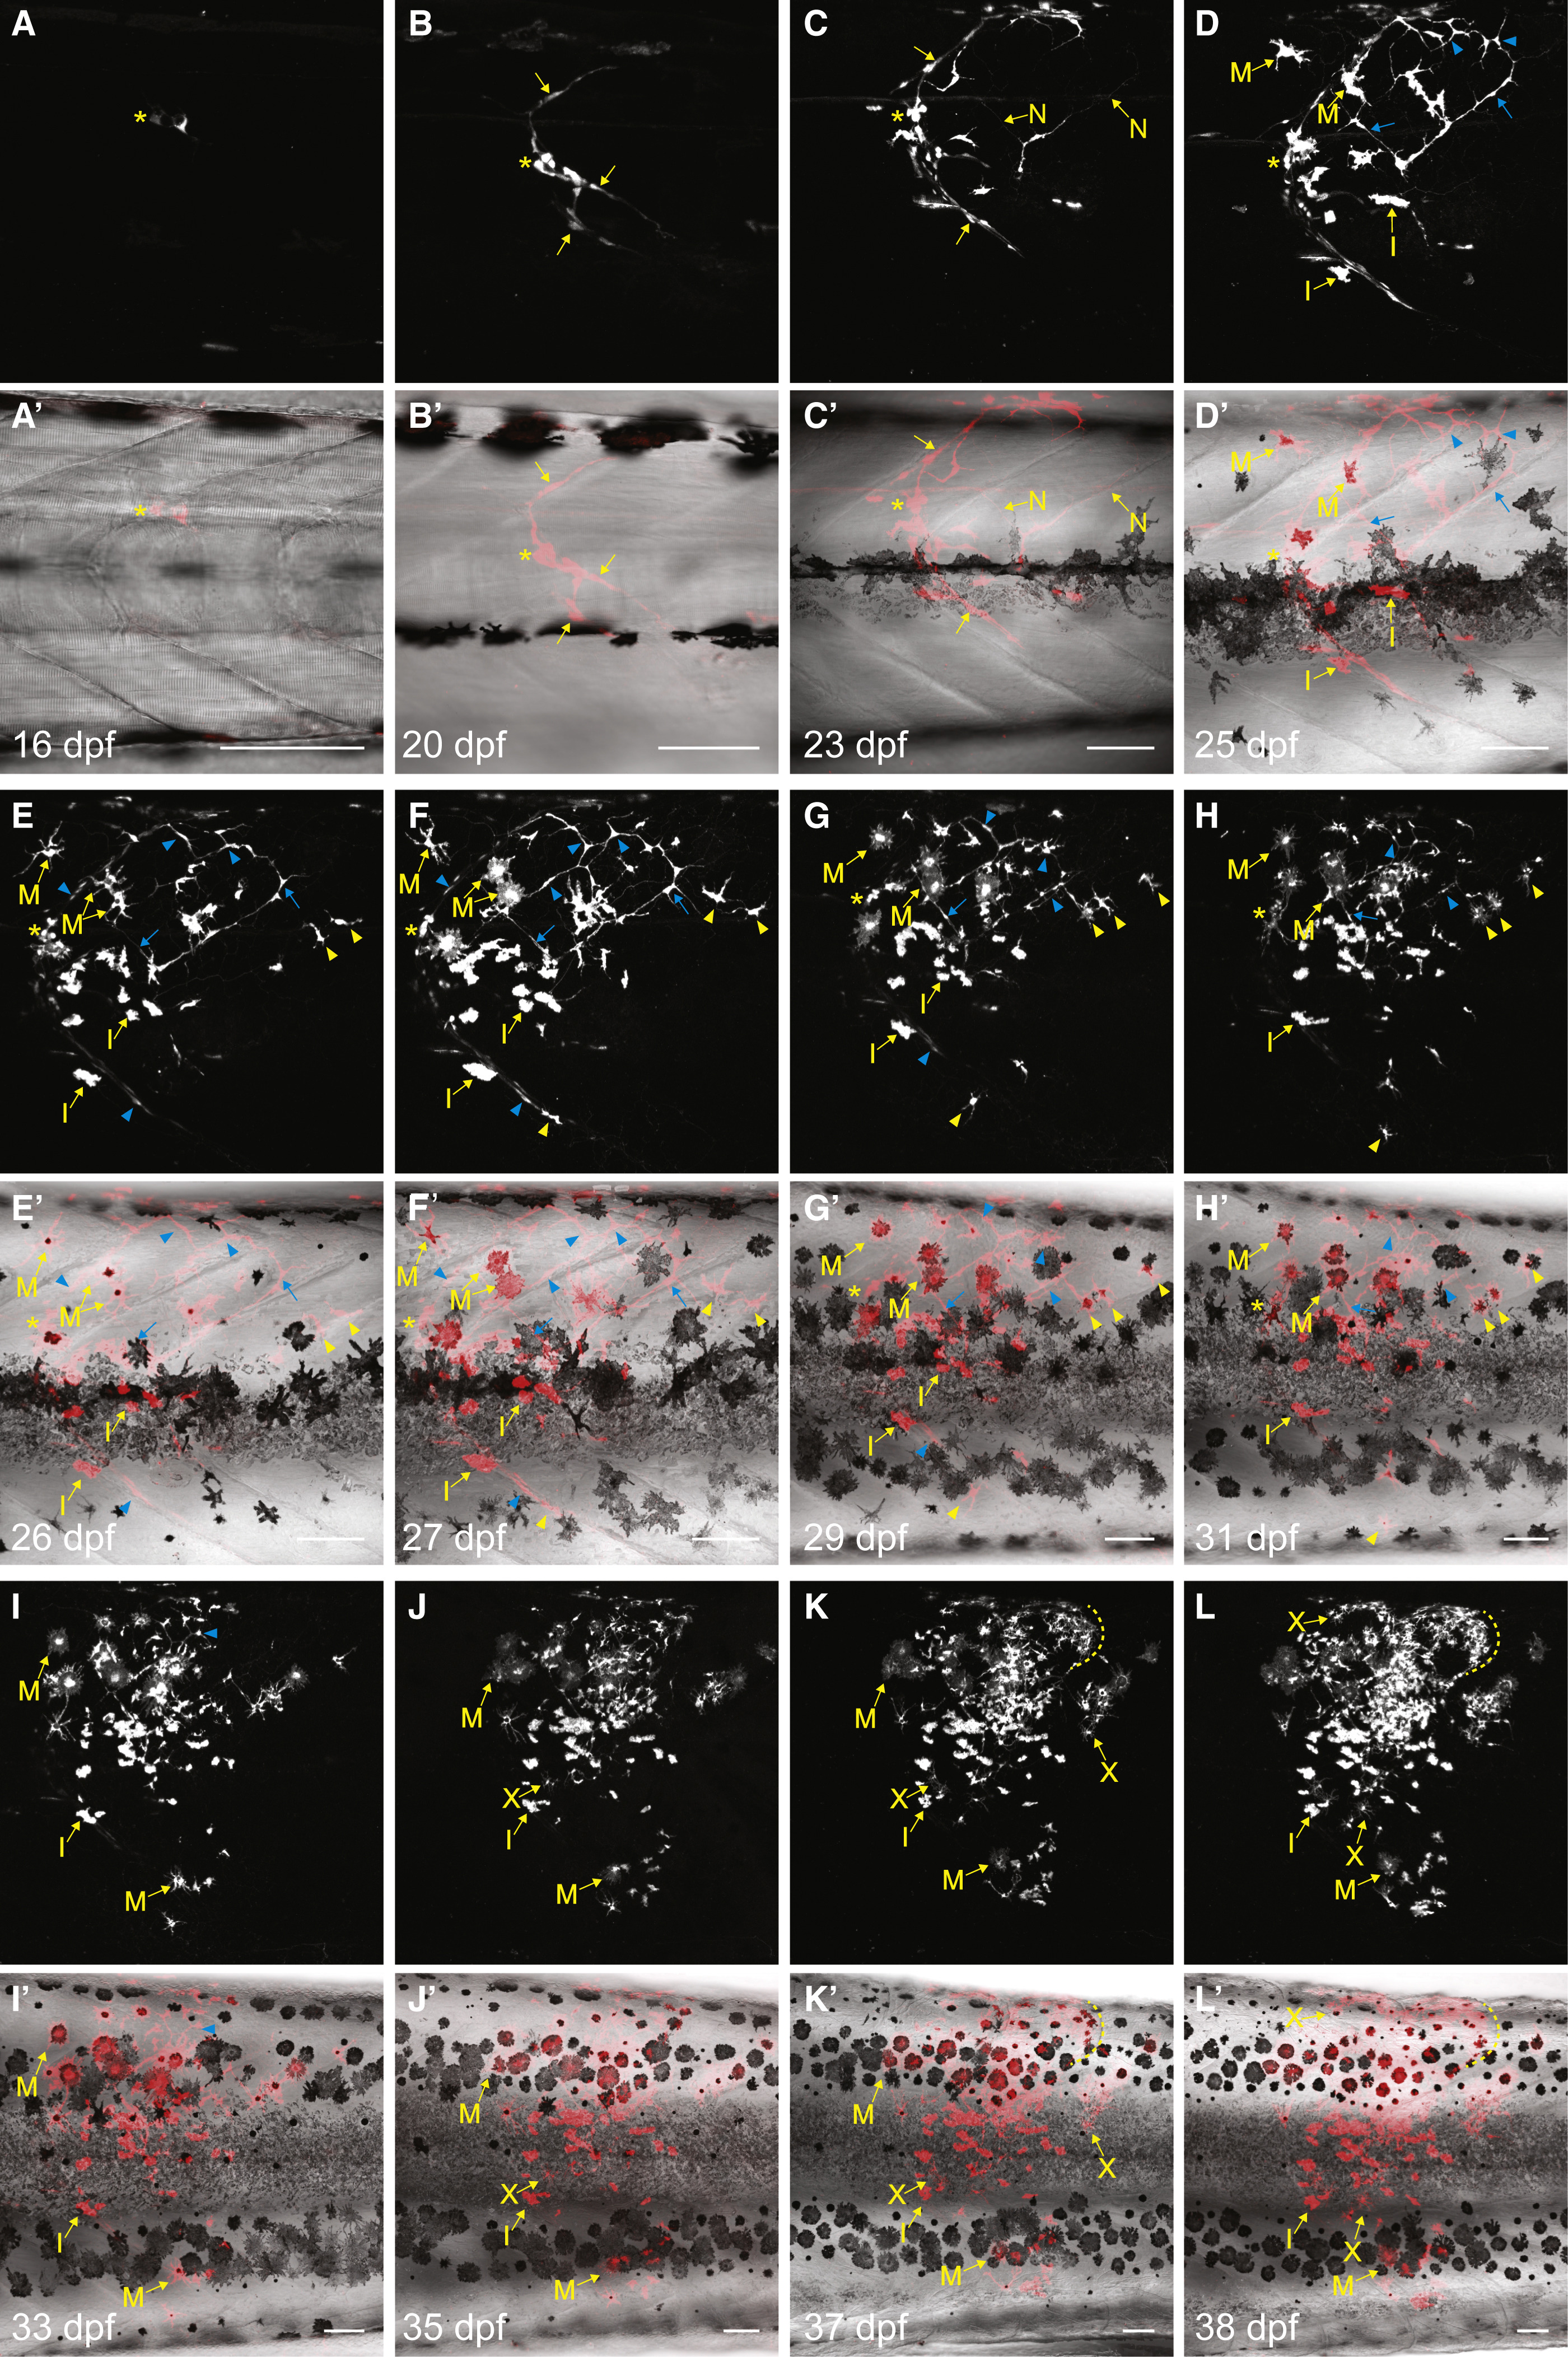
Long-Term Imaging of Progenitors that Make Neurons and Three Pigment Cell Types
(A-L′) Repeated imaging of a clone induced at 5 dpf in zebrafish carrying Tg(sox10:ERT2-Cre) and Tg(βactin2:loxP-STOP-loxP-DsRed-express). Grayscale in (A)-(L): clone; Red/gray scale in (A′)-(L′): clone/bright field. Asterisks indicate the DRG. Yellow arrows indicate nerve routes, unless indicated otherwise; blue arrows and arrowheads show undifferentiated progenitors; yellow arrowheads in (E)-(H′) show undifferentiated progenitors that make melanophores; dashed curves indicate pigment cells of a scale. Scale bars, 100 µm. See also Figure S3.
Reprinted from Developmental Cell, 38(3), Singh, A.P., Dinwiddie, A., Mahalwar, P., Schach, U., Linker, C., Irion, U., Nüsslein-Volhard, C., Pigment Cell Progenitors in Zebrafish Remain Multipotent through Metamorphosis, 316-30, Copyright (2016) with permission from Elsevier. Full text @ Dev. Cell