
Image
|
Figure Caption
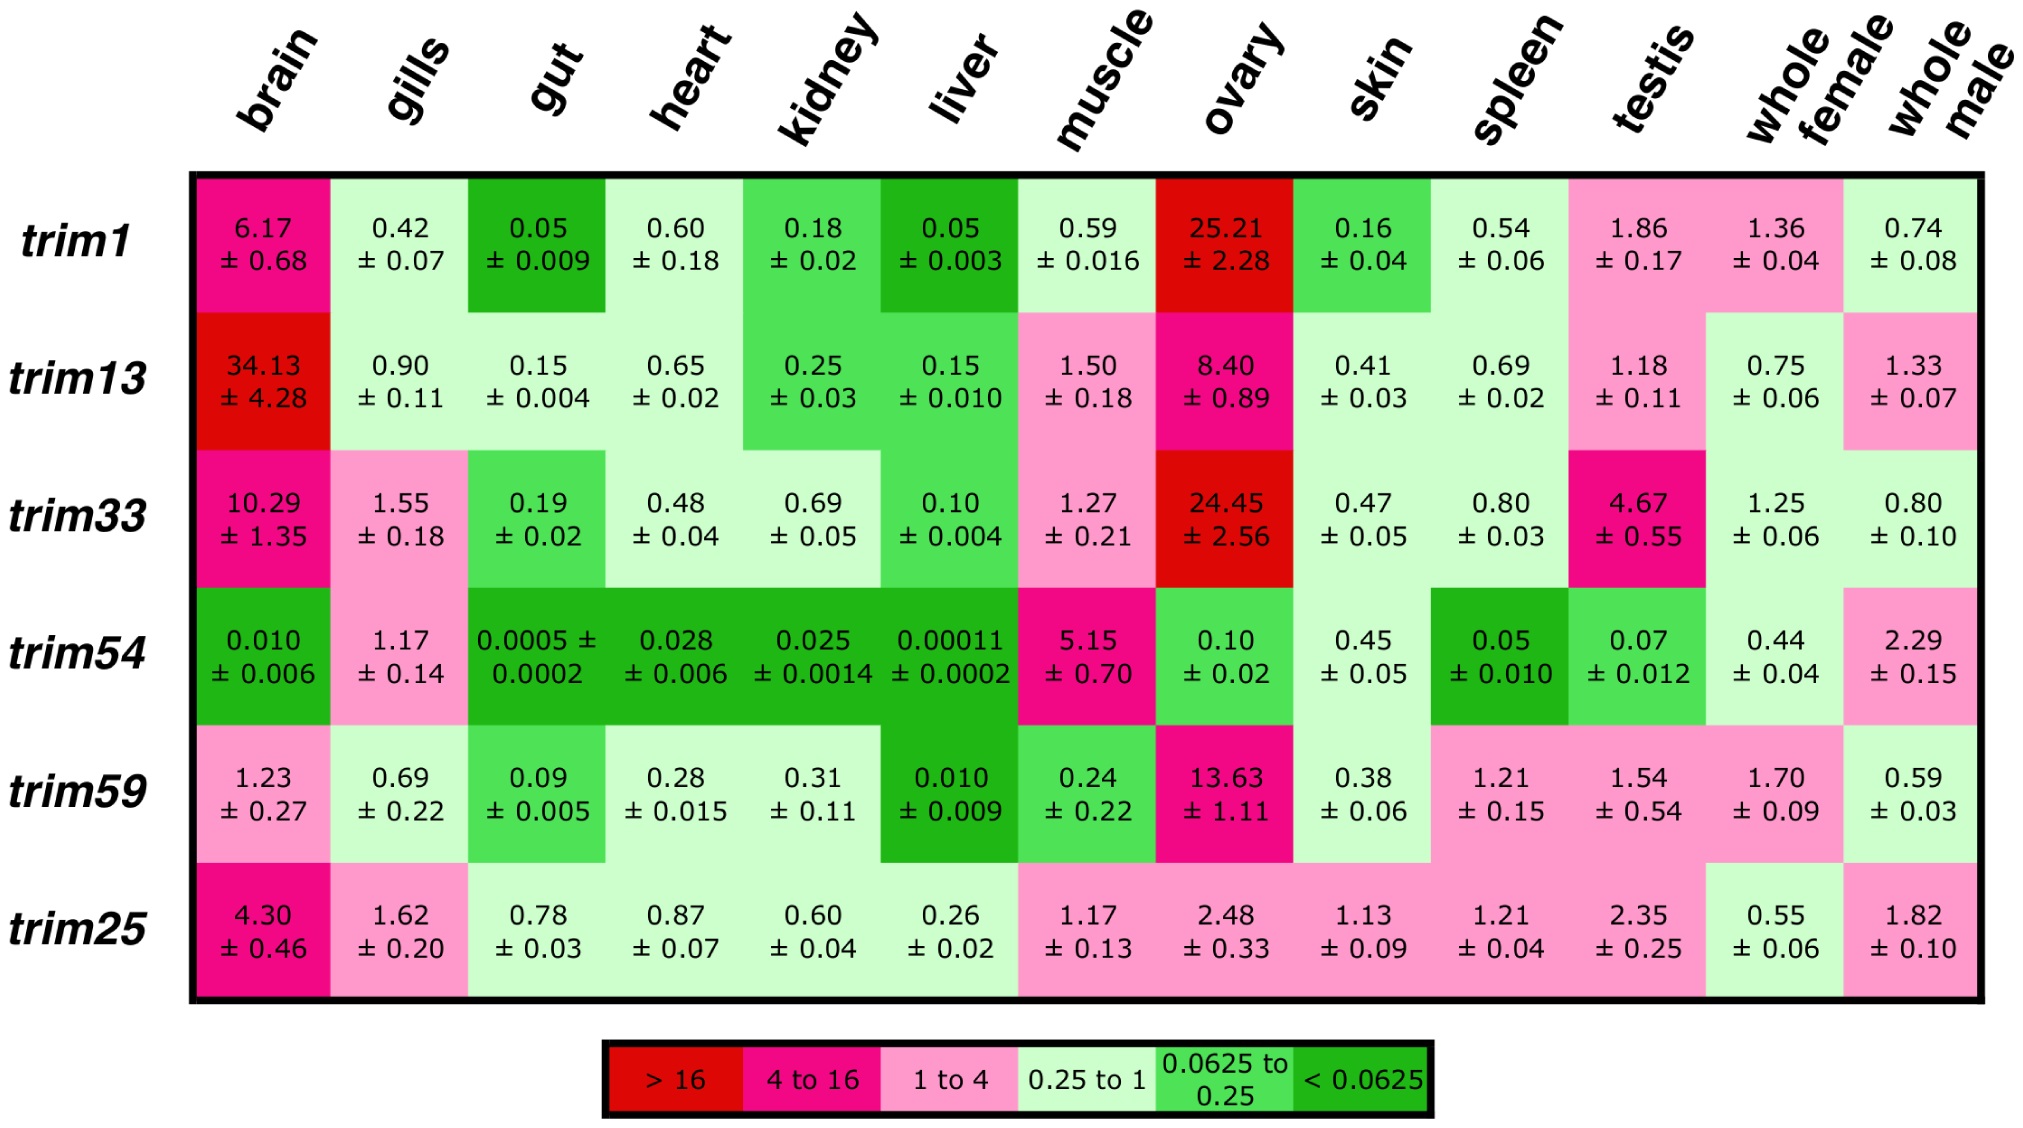
Fig. 2
Expression profile of selected trim genes.
The expression of 6 zebrafish trim genes was measured by quantitative RT-PCR in pools of tissues from 10-12 animals. E1f-α was used as a housekeeping gene, and the relative expression levels of trim genes were normalized on the geometric mean of the values measured for “whole males” and “whole females”, to take both sexes into account in the normalization. The data are represented as a heat map, with expression level and standard deviation is indicated for each condition.
Figure Data
Acknowledgments
This image is the copyrighted work of the attributed author or publisher, and
ZFIN has permission only to display this image to its users.
Additional permissions should be obtained from the applicable author or publisher of the image.
Full text @ PLoS One