
|
Fig. S3
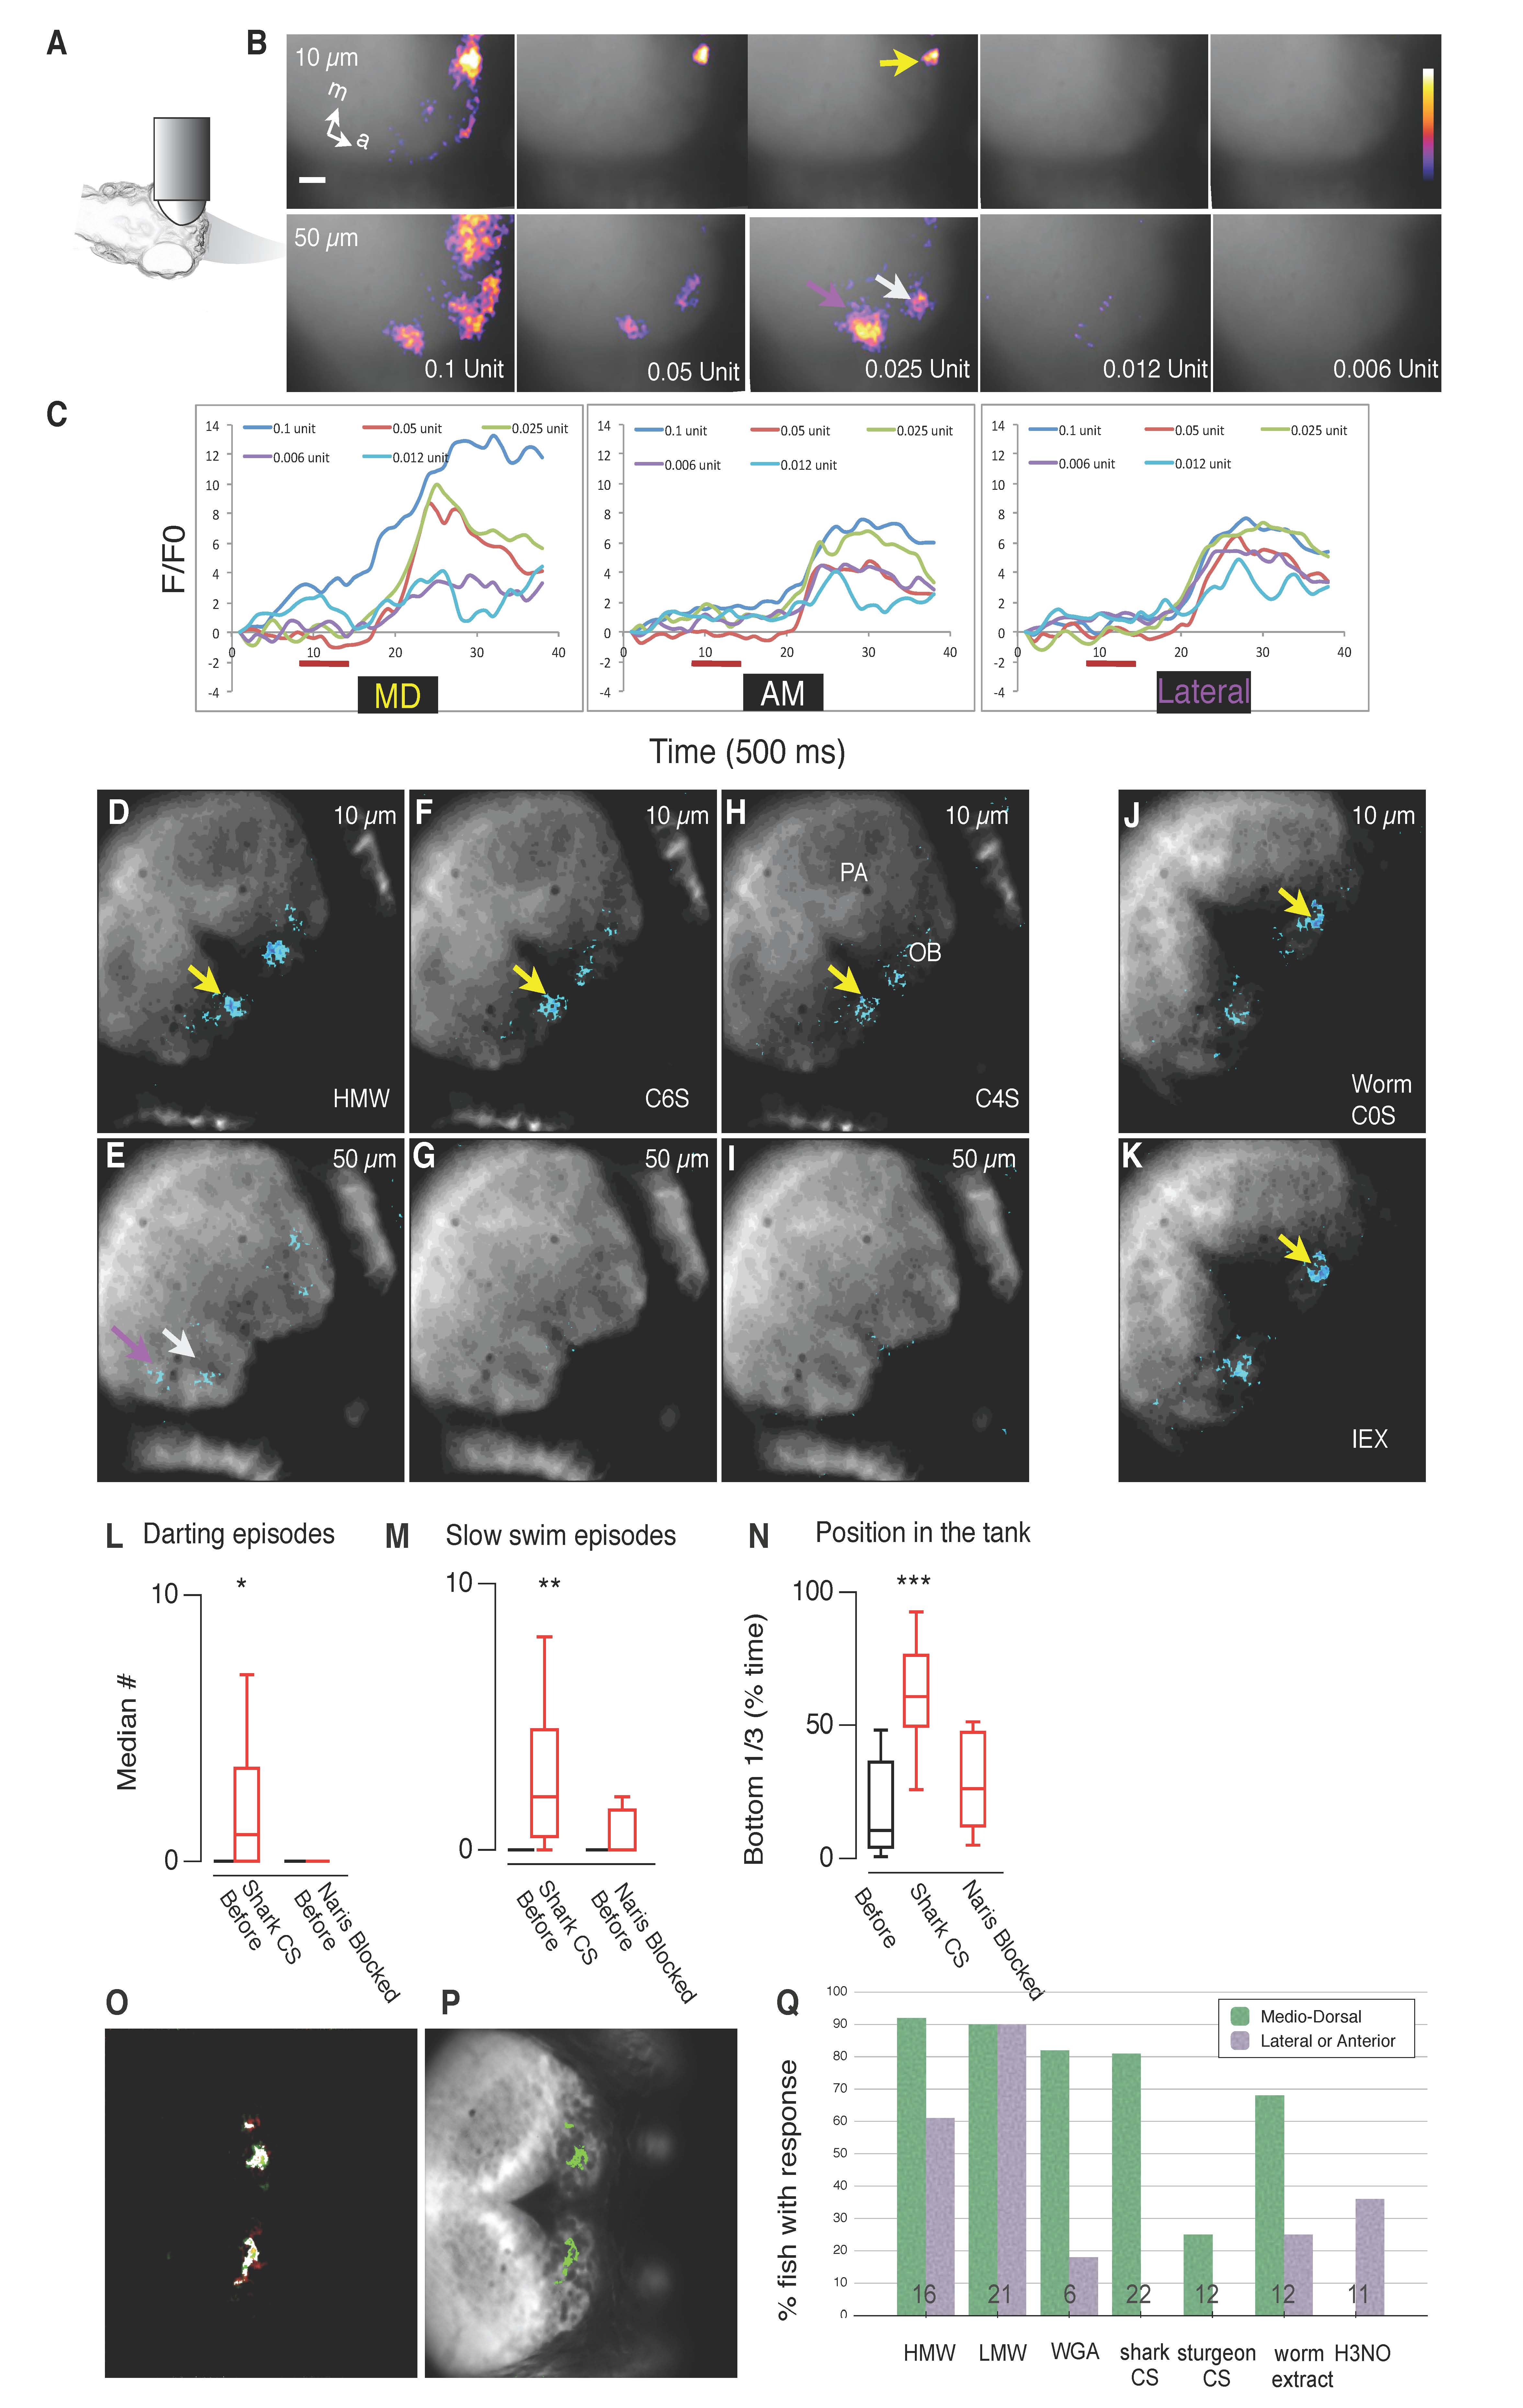
Olfactory Responses to Schresckstoff Components
(A) A 3 to 5 weeks old fish, with odorant directed towards the olfactory pits while the brain is imaged from above.
(B) Calcium increase in the OB following stimulation with different amounts (2-fold dilutions, starting at 0.1 units) of the active fraction from the anion-exchange column in the medio-dorsal (yellow arrow) anterio-medial (white) and lateral (magenta) at two planes (relative position in um indicated on the panels).
(C) Temporal responses at these loci after stimulus (red bar) to different concentrations (see legend). (D-I) Response in the bulb at two different focal planes, following stimulation with HMW
(D, E), C6S purified from shark cartilage
(F, G), C4S purified from sturgeon.
(J, K) Response in the bulb at one plane to C0S purified from Caenorhabditis elegans, and active fraction from anion exchange clolumn (IEX) in a different fish (relative position in um indicated on the panels).
(L-N) Median number of darting (L), slow swim episodes (M) and position in tank to Shark CS after blocking the naris using a tissue adhesive (n=5). Shark CS responses plotted from Fig. 4 for comparison.
(O, P) Overlap of calcium signal elicited by IEX and shark CS (see Figure 5L, M). The region of overlap is shown in white in panel O; red indicates fluorescence from IEX and green from shark CS.
(P) The region of overlap (green) overlaid on an image of GCaMP2 fluorescence from that plane.
(Q) Percentage of fish with a calcium response in the olfactory bulb to the specified odorant. The number of fish analyzed is indicated