
|
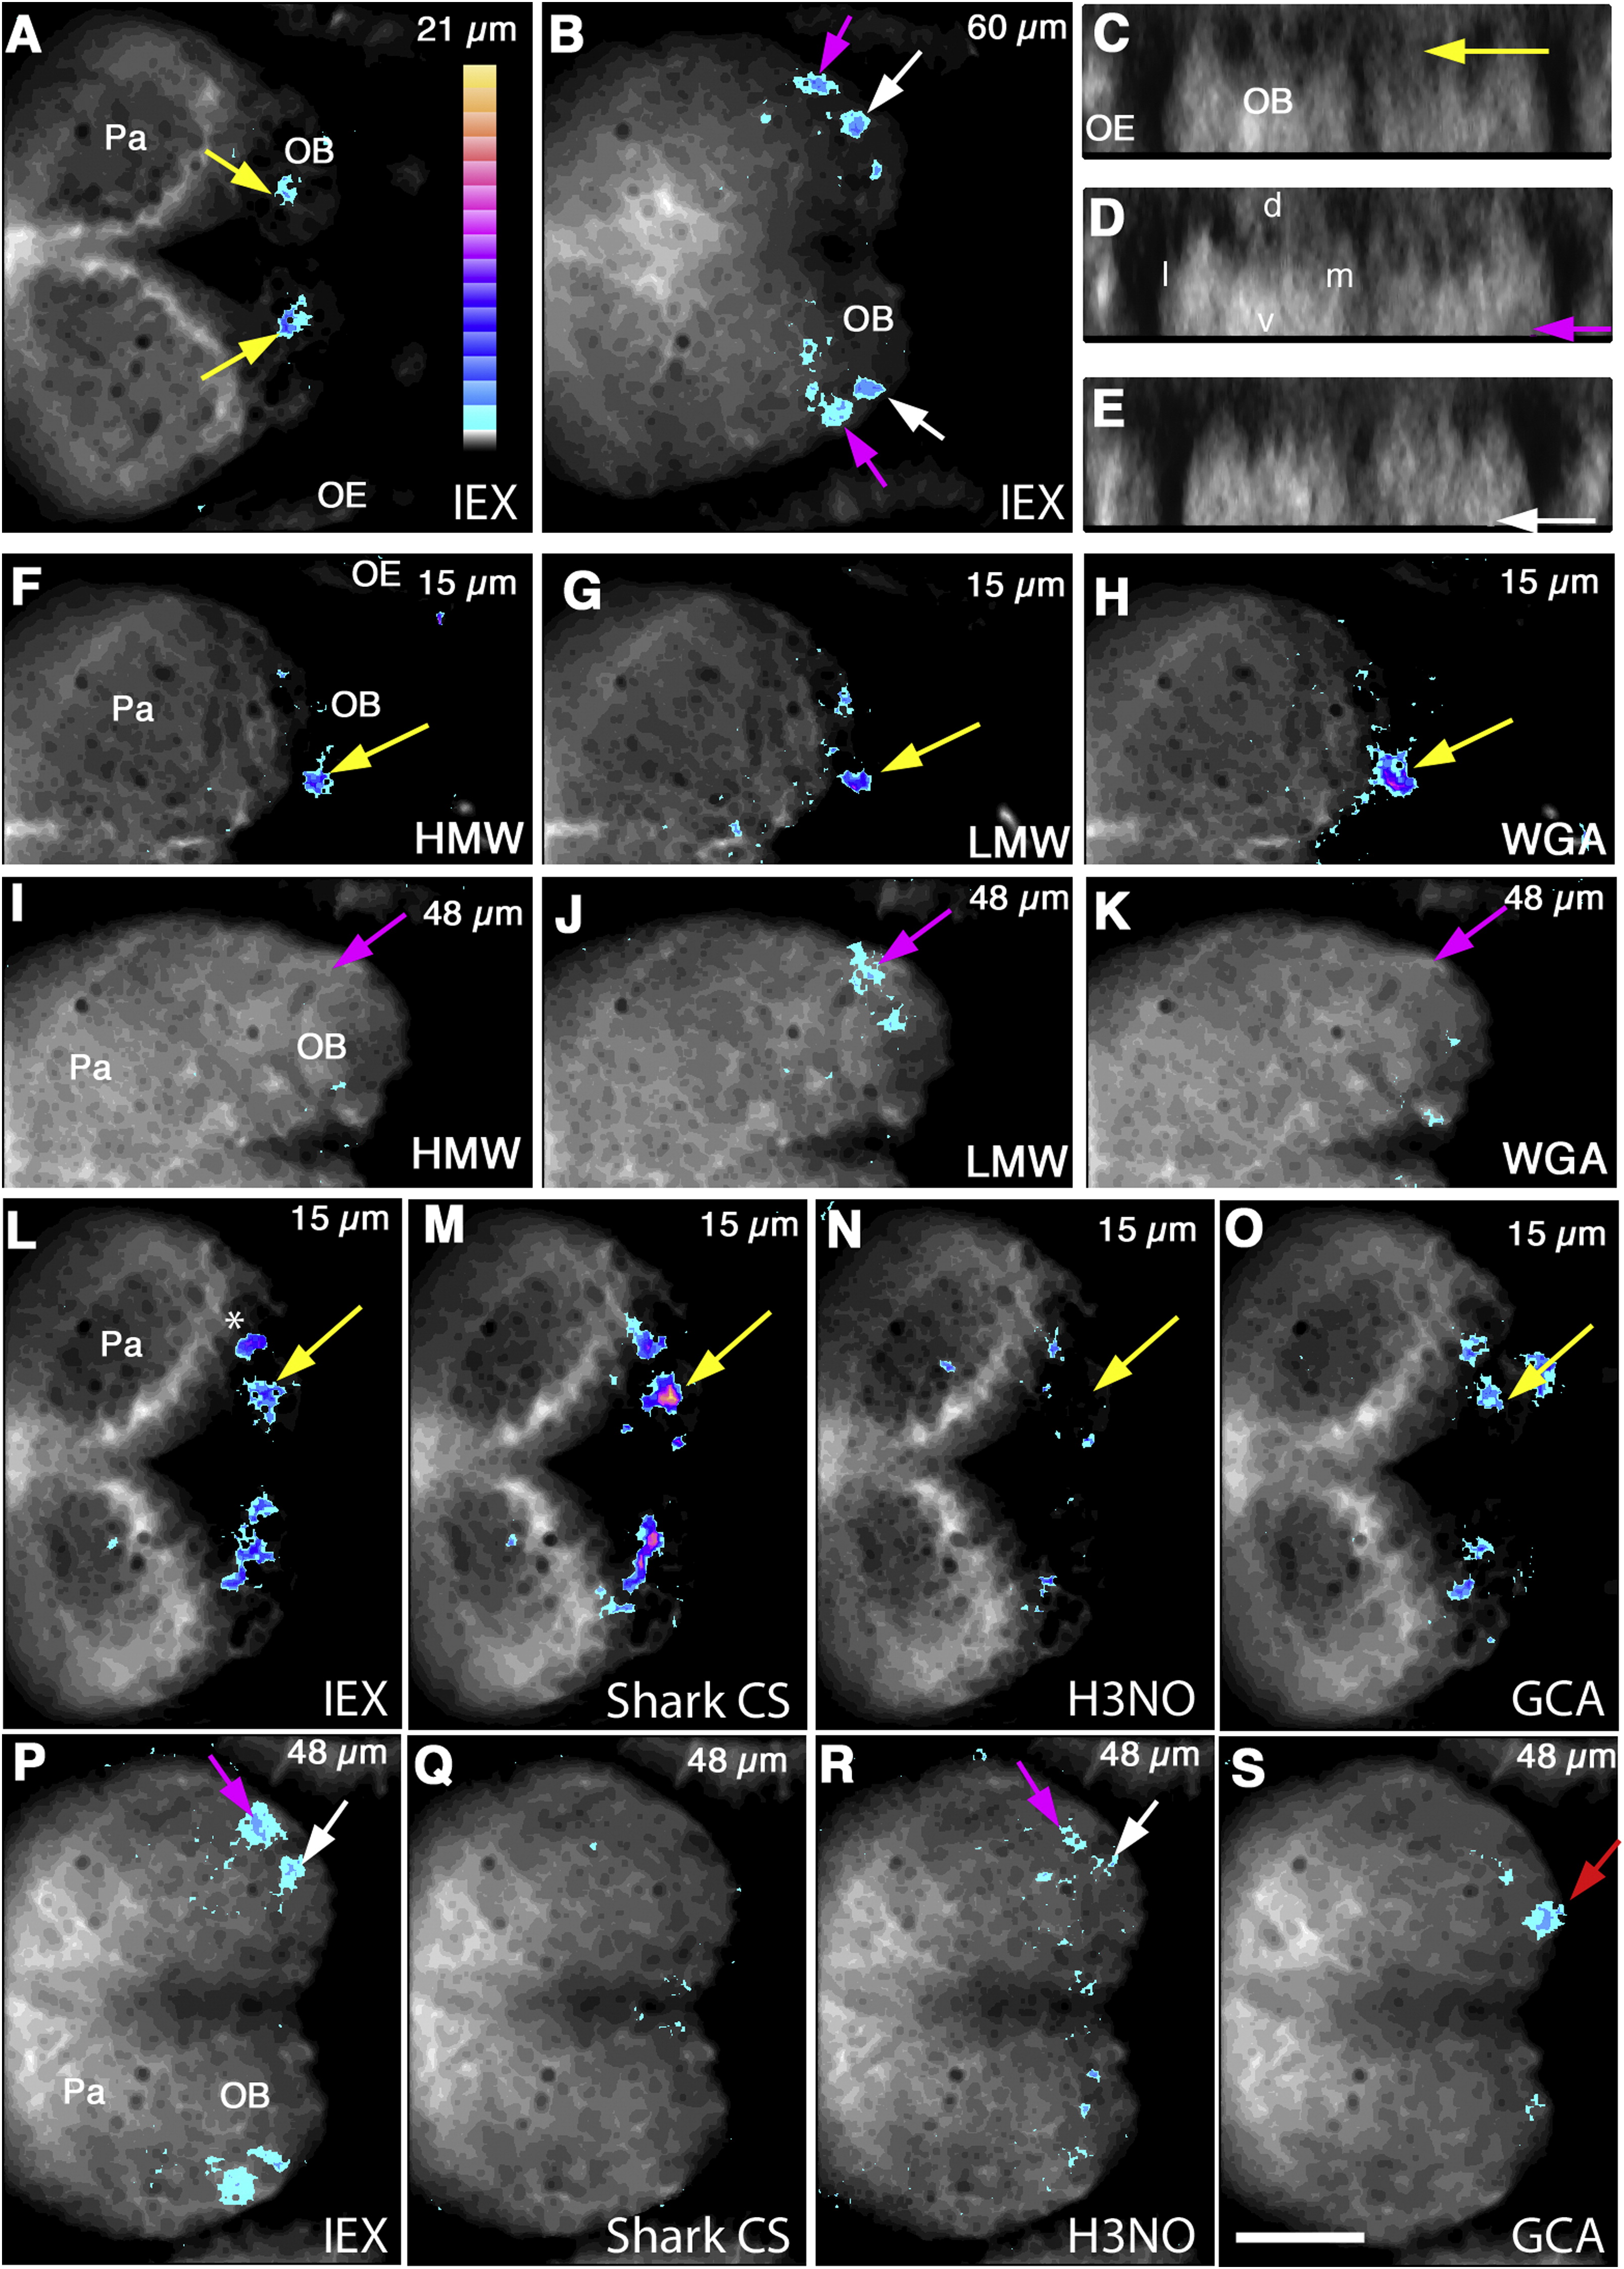
Fig. 5
Olfactory Bulb Response to Skin Extract and Purified Chondroitin Sulfate
(A-F) Increase in calcium in the mediodorsal (yellow arrow), anterior (white arrow) and lateral (magenta arrow) olfactory bulb, in response to stimulation of the olfactory epithelium with the active fraction of skin extract obtained by ion exchange chromatography.
(A and B) Dorsal view of the olfactory bulb, at two different focal planes as indicated by the numbers on the top right of each panel.
(C-E) Positions of the active loci, in frontal views generated from deconvolved z stacks at the level of arrows.
(F-K) Activity in the left olfactory bulb of a 25-day-old fish, in response to HMW, LMW, and eluate from the WGA column. The images here show a dorsal view of the left bulb, at two different focal planes.
(L-S) Response in the bulb at two different focal planes in another fish, following stimulation with partially purified skin extract (L and P), chondroitin sulfate purified from shark cartilage (M and Q), H3NO (N and R), and glycocholic acid (O and S; red arrow). The asterisk in (L) indicates a signal in the pallium. OE, olfactory epithelium; OB, olfactory bulb; Pa, pallium; IEX, active fraction from ion exchange column; d, dorsal; v, ventral; m, medial; l, lateral. Scale bar represents 50 µm; anterior is to the right in all cases. The wedge in (A) shows the look-up table used for ratio images. An intensity-modulated look-up table is used, with grays representing a ratio of 1 and yellows representing a ratio of 2.5. See also Figure S3.