
|
Fig. S6
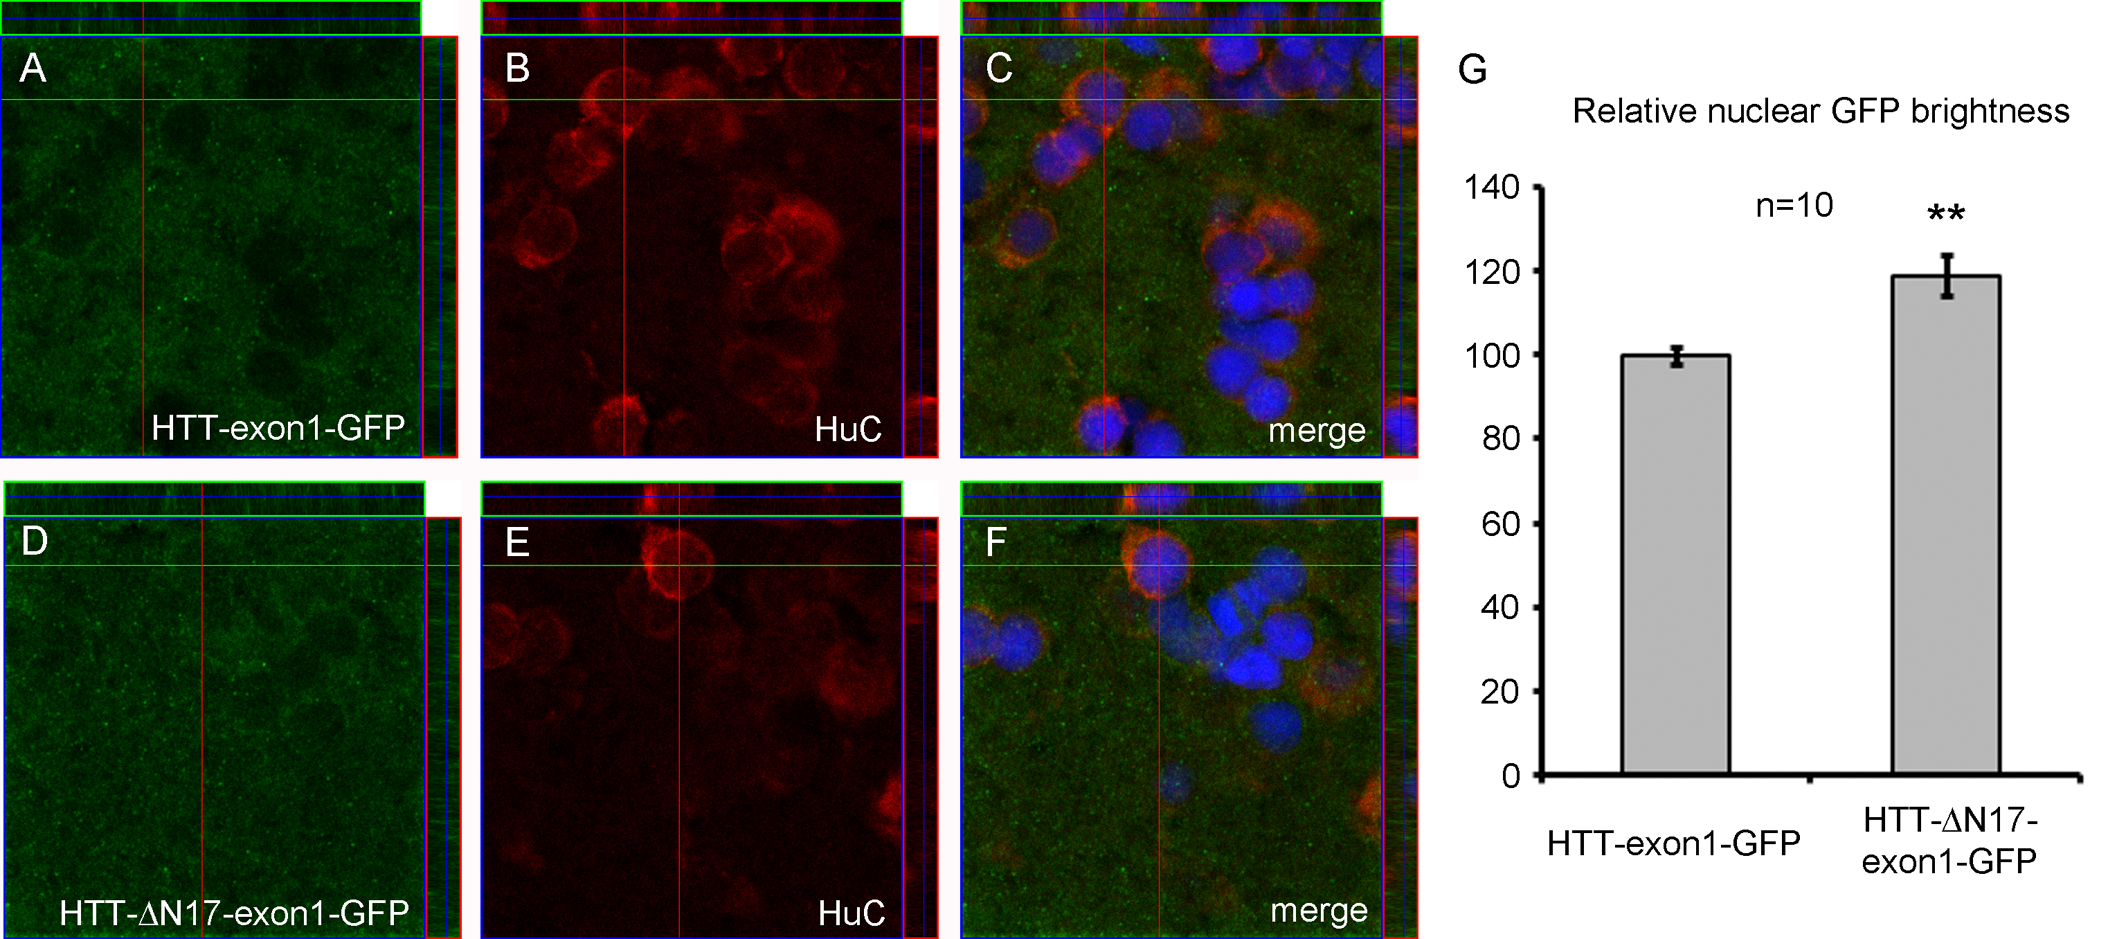
Ubiquitous HTT-exon1-GFP expression in HTT-exon1 and HTT-ΔN17-exon1 lines. 3D projections of confocal images of brain sections from HTT-exon1 L1 (A-C) and HTT-ΔN17-exon1 L1 (D-F) stained for GFP and HuC. Note the faint nuclear GFP staining in HTT while HTT-ΔN17-exon1 has brighter nuclear GFP. (G) Relative nuclear GFP intensity measurements in HuC+ cells comparing HTT-exon1-GFP versus HTT-ΔN17-exon1, n = 10 cells each, **p < 0.01, students t-test. Measurments were made using ImageJ and normalized to average GFP intensity across the entire area. HTT-exon1-GFP was arbitrarily set at 100 %. HTT-ΔN17-exon1 nuclei were approximately 20 % brighter.