
|
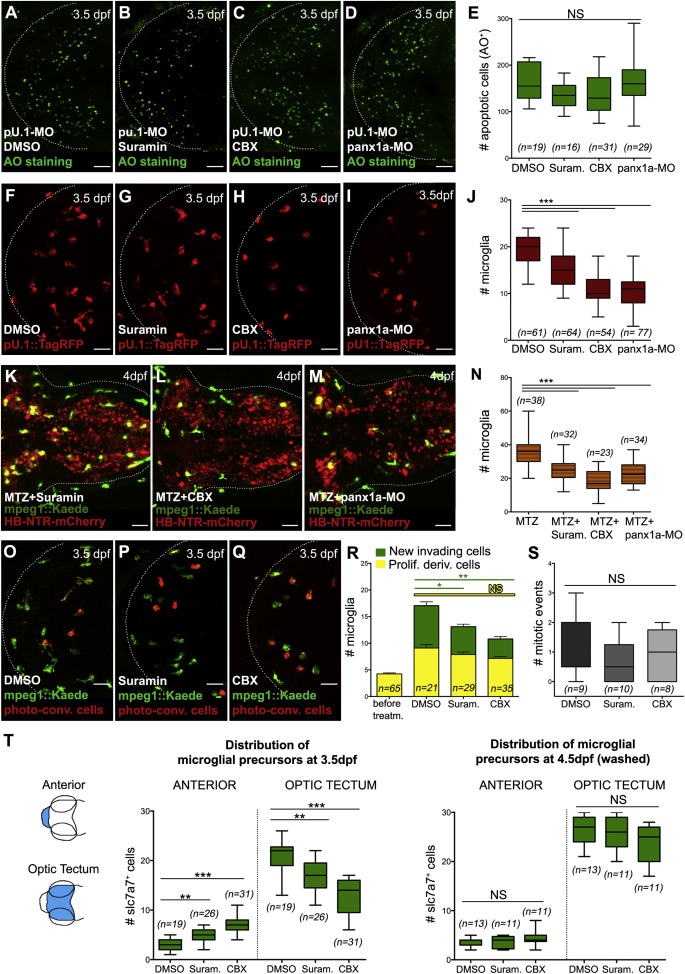
Fig. 4
Nucleotide Release Downstream of Neuronal Cell Death Recruits Microglial Precursors into the Brain
(A-E) AO staining (A-D) and quantification (E) of apoptotic nuclei in 4-dpf pU.1-morphant embryos, 24 hr after treatment with DMSO (A), suramin (B), CBX (C), and pannexin1a-MO (D), are shown.
(F-J) Microglial distribution (F-I) and quantification (J) in pU.1::GAL4-UAS::TagRFP embryos, 24 hr after treatment with DMSO (F), suramin (G), CBX (H), and pannexin1a-MO (I), are shown.
(K-N) Representative hindbrain (K-M) and quantification (N) of an mpeg1::GAL4-UAS::Kaede;HB::NTR-mCherry embryo at 4 dpf, 24 hr after treatment with MTZ + suramin (K), MTZ + CBX (L), and MTZ + pannexin1a-MO (M). Dotted lines mark the hindbrain.
(O-Q) Dorsal views of mpeg1::GAL4-UAS::Kaede embryos 24 hr after photo-conversion of microglia and treatment with DMSO (O), suramin (P), and CBX (Q). Newly entered microglia are in green. Microglia derived from converted cells are in red/yellow.
(R) Quantification of microglia deriving from cell invasion and in loco proliferation 24 hr after photo-conversion and drug treatment is shown.
(S) Quantification of mitotic events in the optic tectum of 2.5-dpf mpeg1::GAL4-UAS::Kaede embryos during <15 hr of DMSO, suramin, or CBX treatment is shown.
(T) Number of slc7a7+ microglial precursors accumulating in the anterior head region and in the optic tectum of slc7a7::Kaede embryos, 24 hr after drug treatment (graph on the left) and drug washout (graph on the right). Blue-colored areas in the schematic indicate the regions of interest.
For all quantifications, data are pooled from three independent experiments. Dotted line delimits the areas of interest. n, number of analyzed embryos; NS, non-significant; *p < 0.05, **p < 0.01, and ***p < 0.001. Scale bar represents 30 µm. See also Figures S3 and S4.