
|
Fig. 6
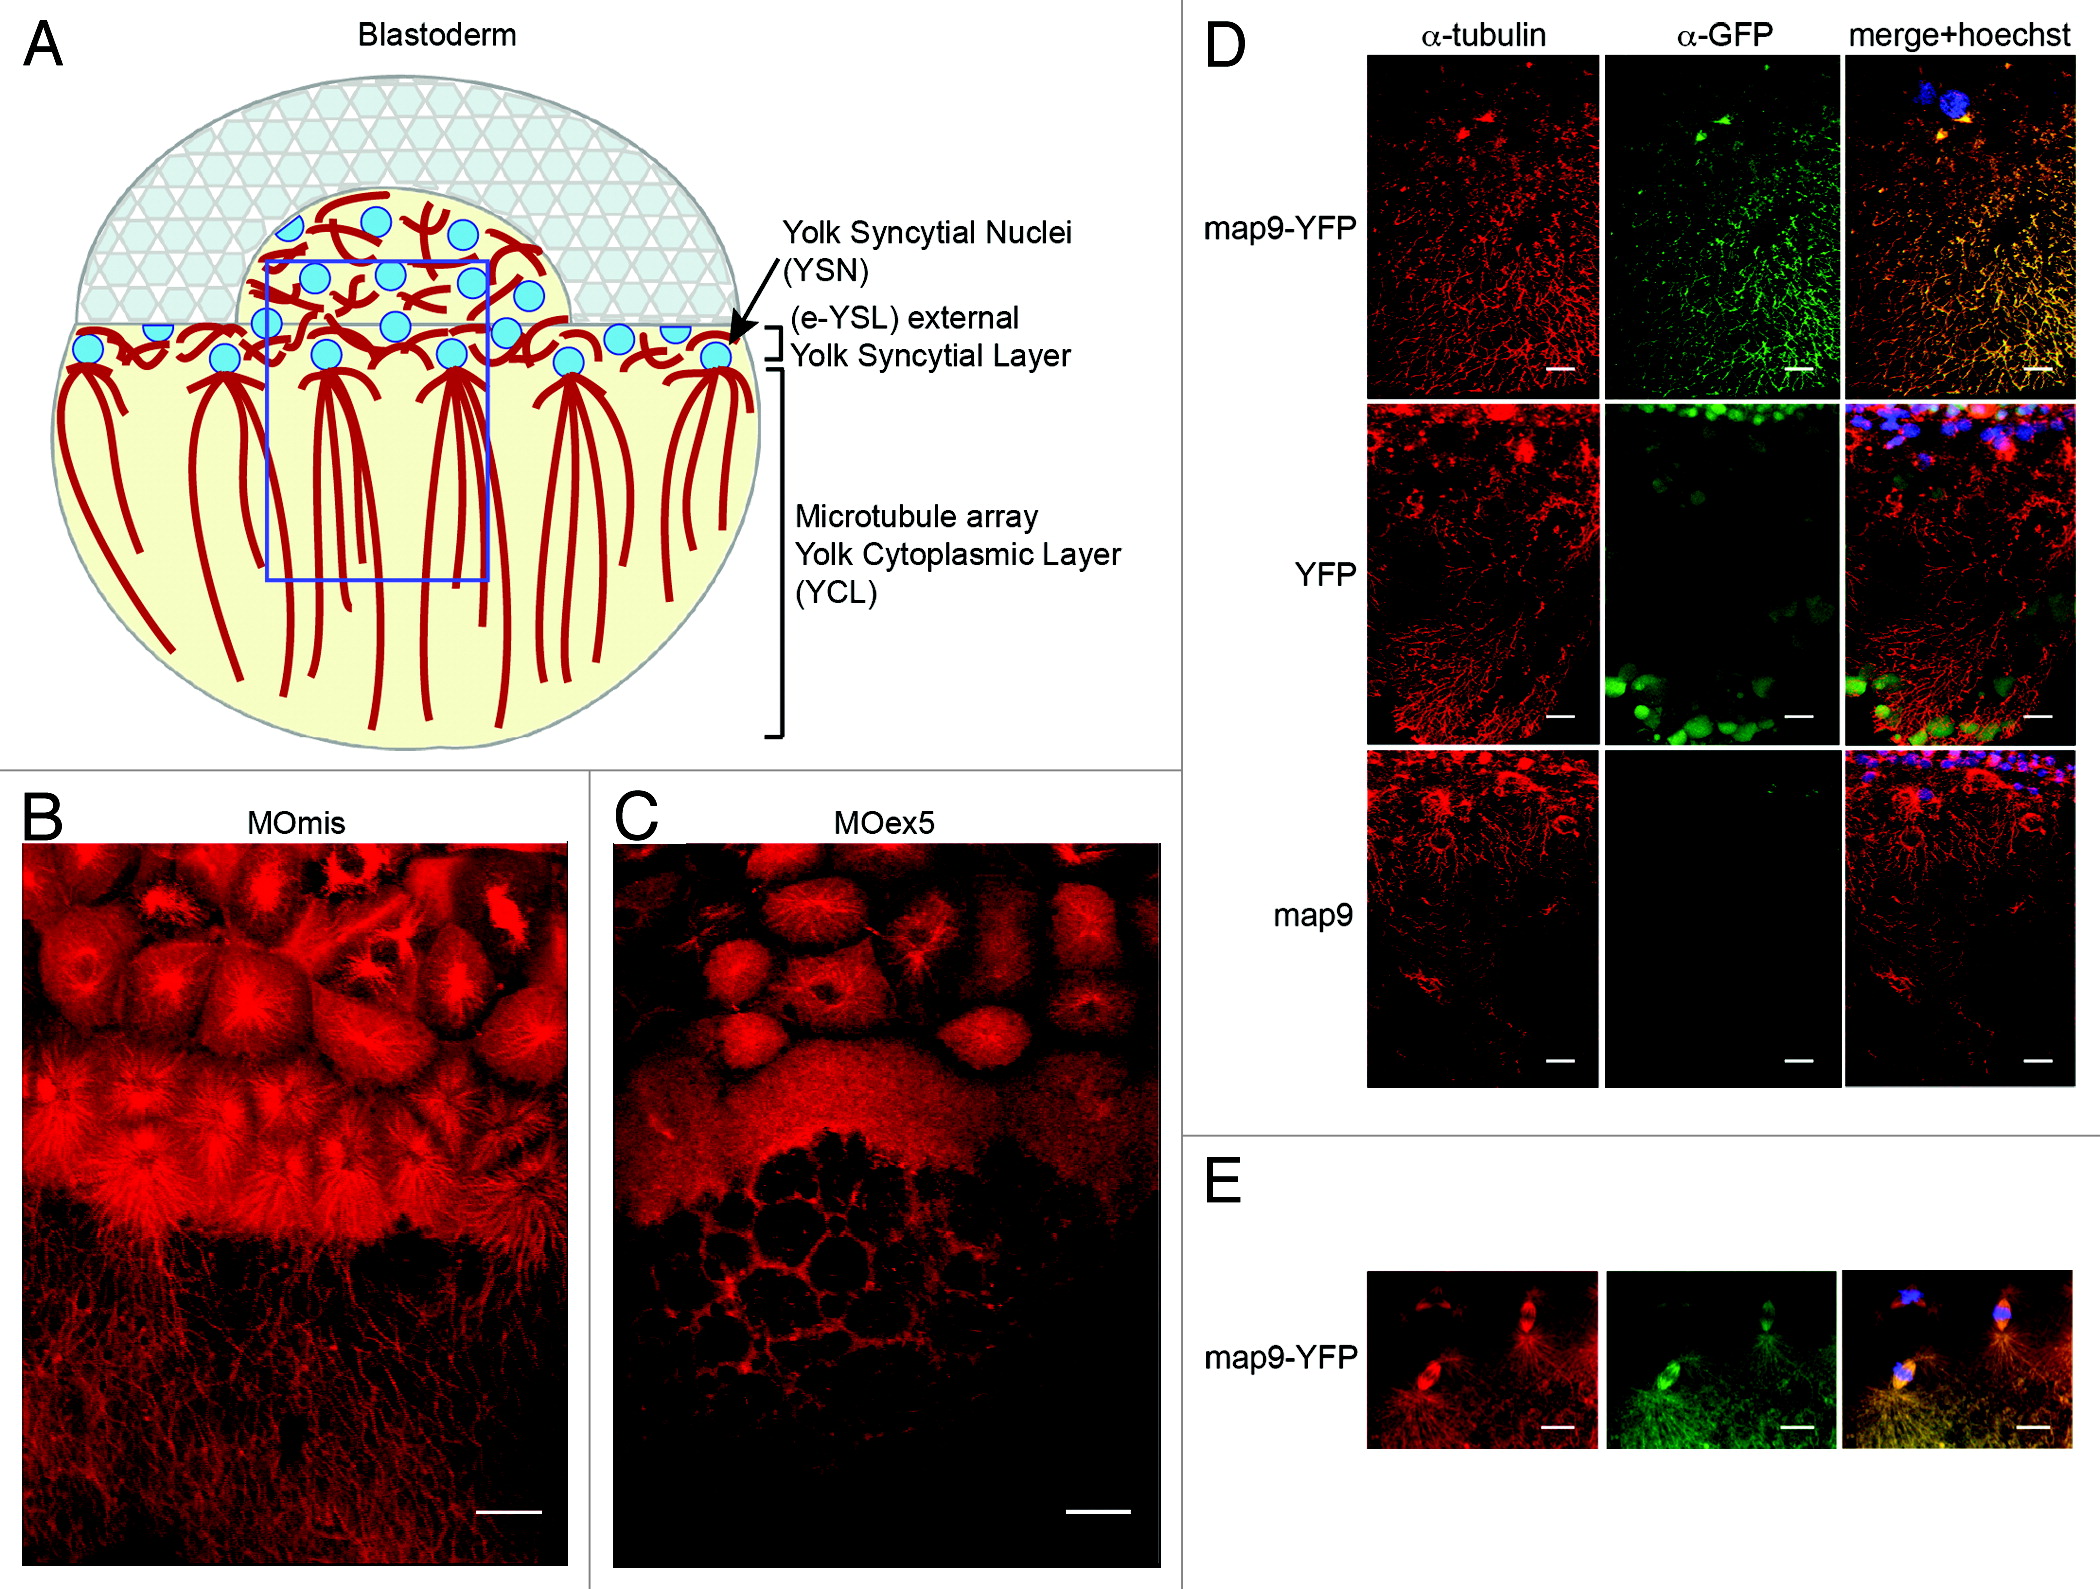
Microtubules in the YSL are disorganized in map9 morphants. (A) Schematic representation of the organization of the YSL and yolk cell MT array in early zebrafish embryos (adapted from ref. 43). The portion boxed in blue represents the region analyzed in (B-D). (B and C) Embryos were injected at the 1-cell stage with 1 pmol of control MOmis (B) or MOex5 (C) and imaged by confocal microscopy at ~4.3 hpf (beginning of epiboly). The MT spindles/array are dense and clearly identified in MOmis-injected embryos, whereas they are depleted in MOex5 morphants. (D) Map9 localizes on the MT network of the YSL. Map9-YFP, YFP, and map9 RNA (200 pg) were injected separately in 1-cell-stage embryos and imaged at 4.3 hpf. The MT network is labeled with an anti-α-tubulin antibody (red), and Map9-YFP is labeled with an anti-GFP antibody. Nuclei are stained with Hoechst 33258. (E) Map9-YFP RNA was injected in 1-cell stage embryos. Map9 colocalizes with α-tubulin on the mitotic spindles of YSL nuclei, (scale bars, 20 µm).