
|
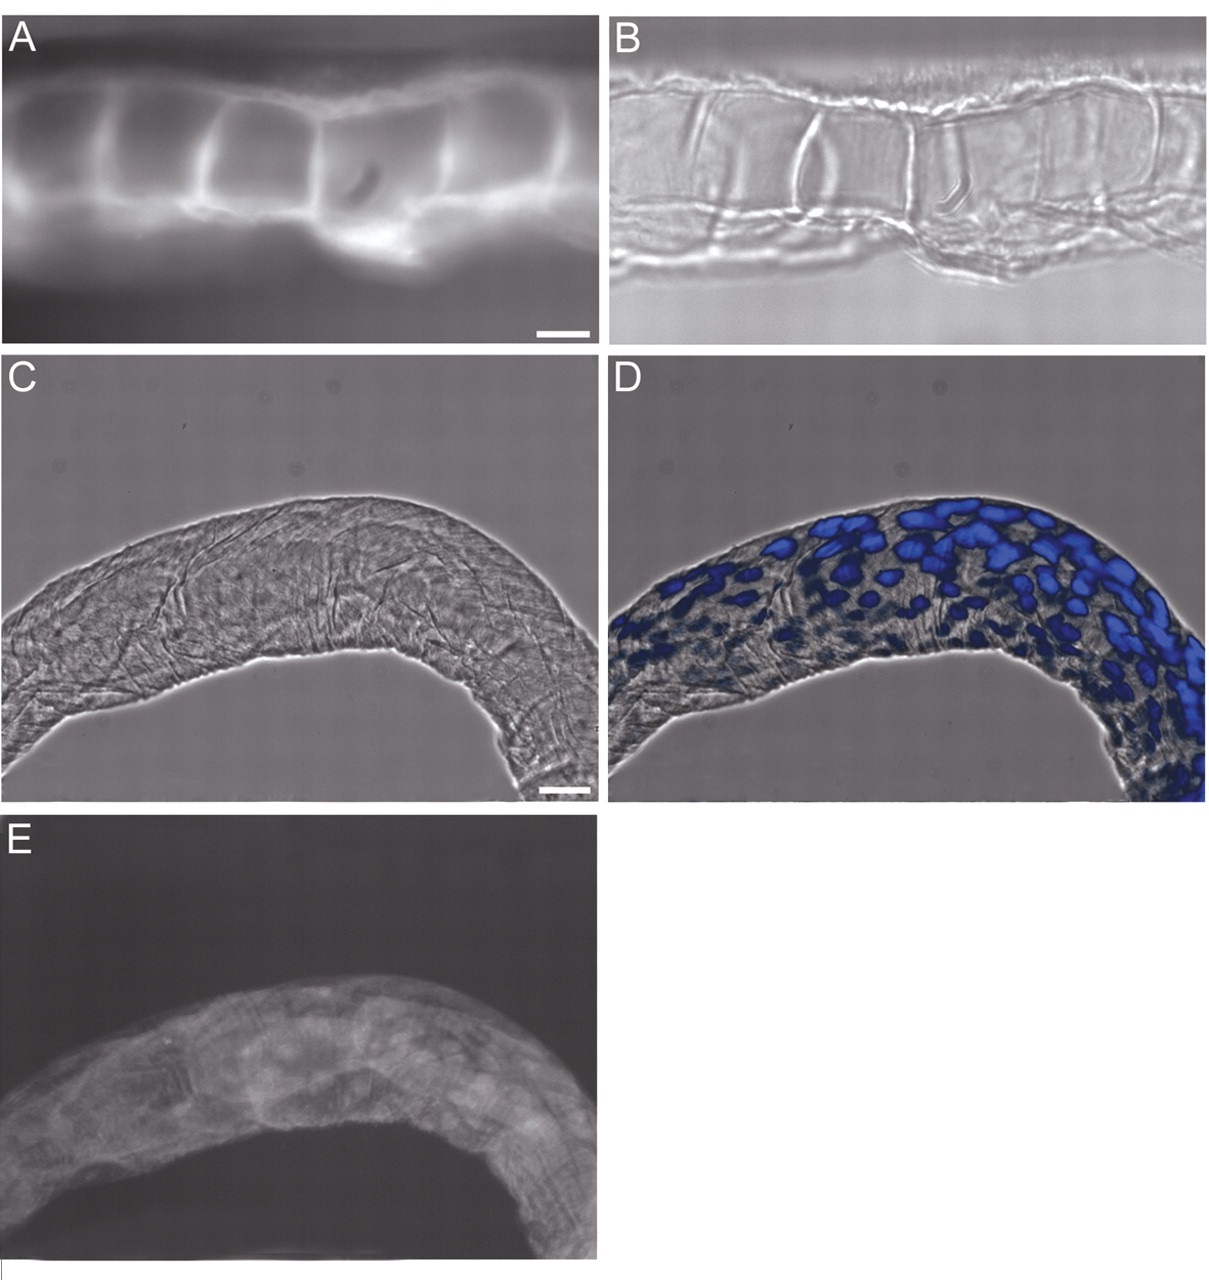
Fig. 3
The notochord deposits bone matrix. (A,B) Notochords were dissected before centrum formation (4 dpf), cultured, and then labelled with quercetin for bone matrix (n=10). (A) After 12 days′ culture, matrix is seen as bright transverse bands. (B) Bright field image of A using DIC optics; bone labelling is seen between cell boundaries. (C) Phase-contrast image of a notochord dissected and fixed at 4 dpf. (D) Composite phase-contrast and DAPI image of C showing nuclei (blue) only within the boundaries of the notochord sheath (adjacent to phase-bright lines); no cells are seen outside the sheath (n=8). (E) Notochord in C labelled with quercetin, showing no positive staining for bone matrix; the notochord is delineated by background fluorescence, and faint nuclear (DAPI) fluorescence is observed in the FITC channel. Scale bars: A,B, ~100 µm; C-E, ~80 µm.