
|
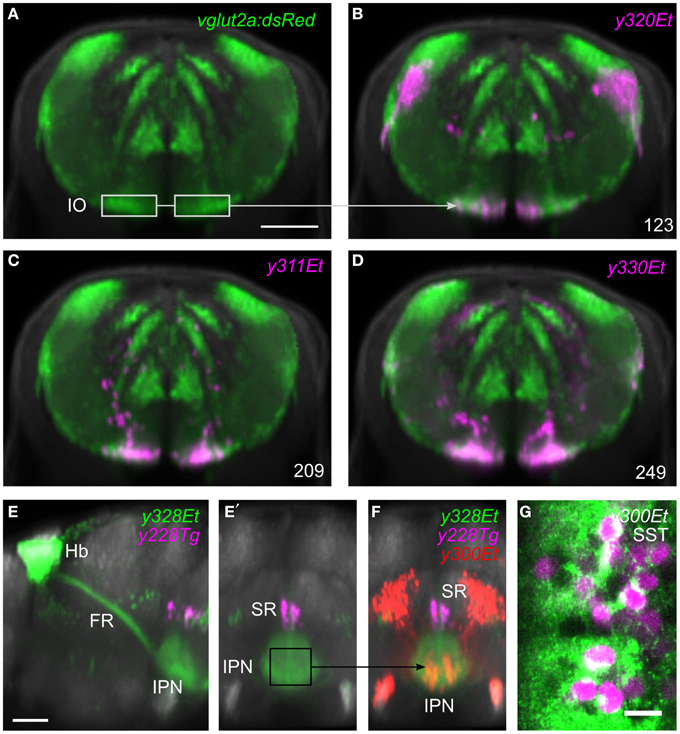
Fig. 4
Region of interest search with the brain browser. (A) Transverse view through caudal medulla of vglut2a:DsRed average brain (green). The boxed regions were used to draw a region of interest around the inferior olive (IO) to search the database for Gal4 lines labeling IO neurons. Scale bar 50 µm. (B-D) The three Gal4 enhancer trap lines that most strongly matched the search area (magenta). Each line contained neurons in the region of the IO. (E) Sagittal and (E′) transverse projections of line y328Et (green) which labels the habenula (Hb) and fasciculus retroflexus (FR) including termination zone in the interpeduncular nucleus (IPN). For orientation, a line labeling the superior raphe (SR) is also shown (y228Tg, magenta). The termination zone of habenula neurons in the IPN was used to create a 3D search region. Scale bar 50 µm. (F) Brain browser image showing the result of the 3D search: enhancer trap line y300Et (red) which contained strongly fluorescent cell bodies within the IPN. (G) Single confocal plane showing immunostaining against somatostatin (SST, green) and transgene expression in y300Et (Kaede fluorescence, magenta) within the IPN. Scale bar 10 µm.