
|
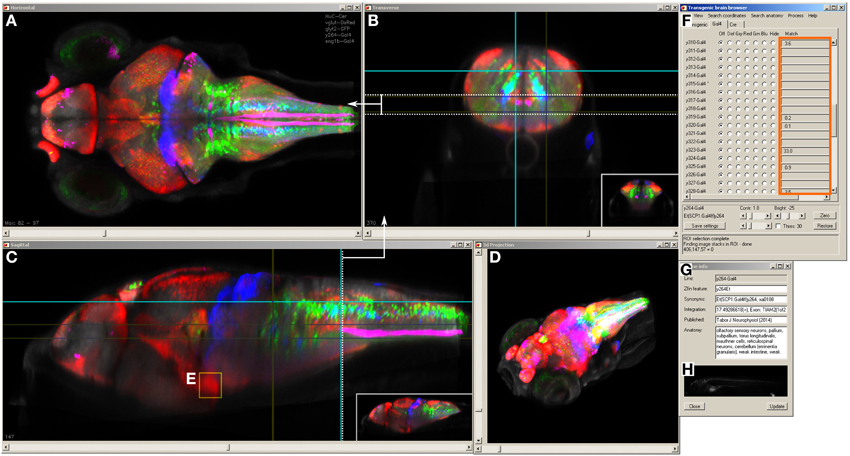
Fig. 3
Brain browser software for searching enhancer trap lines. The browser displays horizontal (A), transverse (or oblique), (B) and sagittal (C) views of user-selected image stacks of transgenic and enhancer trap lines. The browser displays single brain slices (B,C), using cross-hairs to indicate the slice location in orthogonal planes (e.g., dotted line in C shows the position of the transverse view in B). Alternatively, maximum projections of selected regions can be visualized (A, between the region indicated by dotted lines in B) or a 3D projection of the whole brain (D). The control panel (F) lists all lines in the database and during searches, indicates lines (orange box) that label selected 3D regions of interest (E) or neuroanatomical structures. Information on the transgene integration site and neuroanatomical annotation are available in an additional panel (G), which also contains epifluorescent images for all Gal4 enhancer trap lines (H).