
|
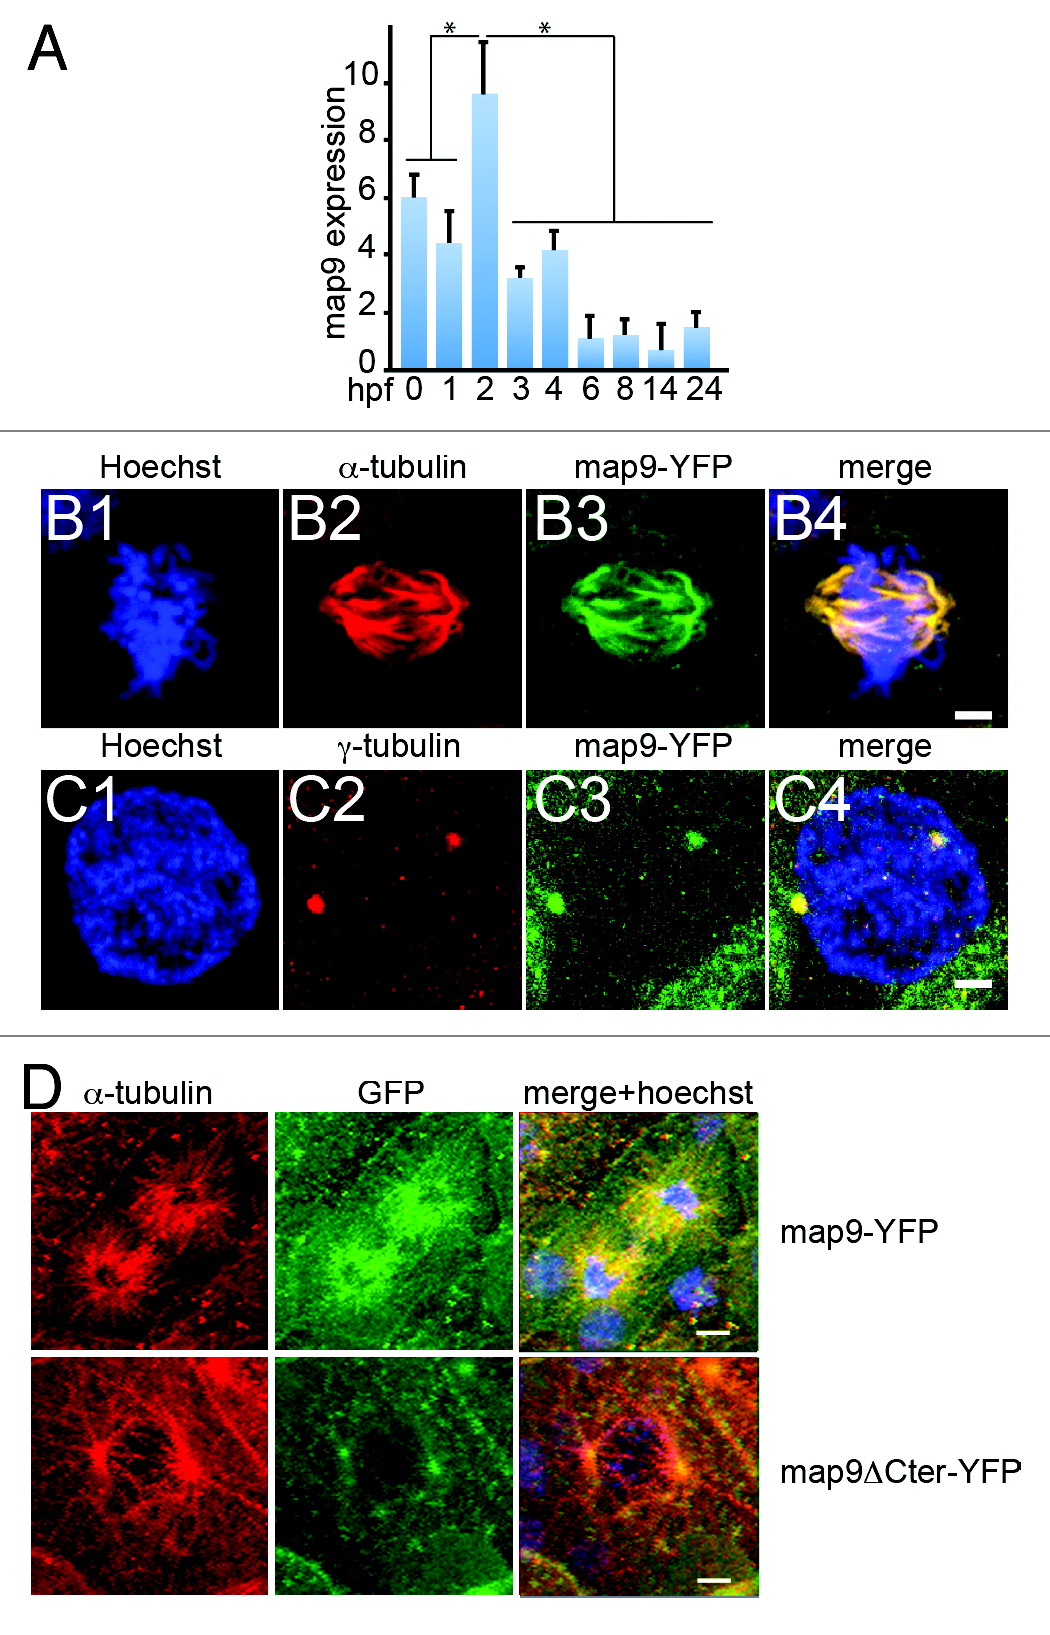
Fig. 1
Expression of map9 in early zebrafish embryos. (A) Relative quantification of map9 mRNA by qPCR in 0 hpf (unfertilized eggs) to 24 hpf embryos. Data are the mean ± SD from 3 independent experiments, with n = 25-35 embryos per time point (*P < 0.005 by Student t test). (Band C) Subcellular localization of Map9 during mitosis in 24 hpf embryos following expression of map9-YFP. Two hundred pg of map9-YFP RNA was injected at the 1-cell stage, embryos fixed at 24 hpf, and stained with an anti-α-tubulin antibody (red) and Hoechst 33258. Confocal microscopy images show that Map9-YFP (green) co-localizes with α-tubulin on the microtubules of the mitotic spindle (B). In interphase cells (C), Map9-YFP co-localizes with γ-tubulin (red) at centrosomes. (Scale bars, 10 µm). (D) Loss of the fiber-like distribution of Map9 lacking its C-terminal MAP domain in mitotic cells. Map9-YFP or map9ΔCter-YFP RNA (200 pg) was injected in 1-cell stage embryos. Embryos were fixed at 24 hpf and stained with anti-α-tubulin, anti-GFP antibodies, and Hoechst 33258. Confocal microscopy images show that Map9-YFP but not Map9ΔCter-YFP co-localizes with α-tubulin on the microtubules of the mitotic spindle. (Scale bars, 10 µm).