
|
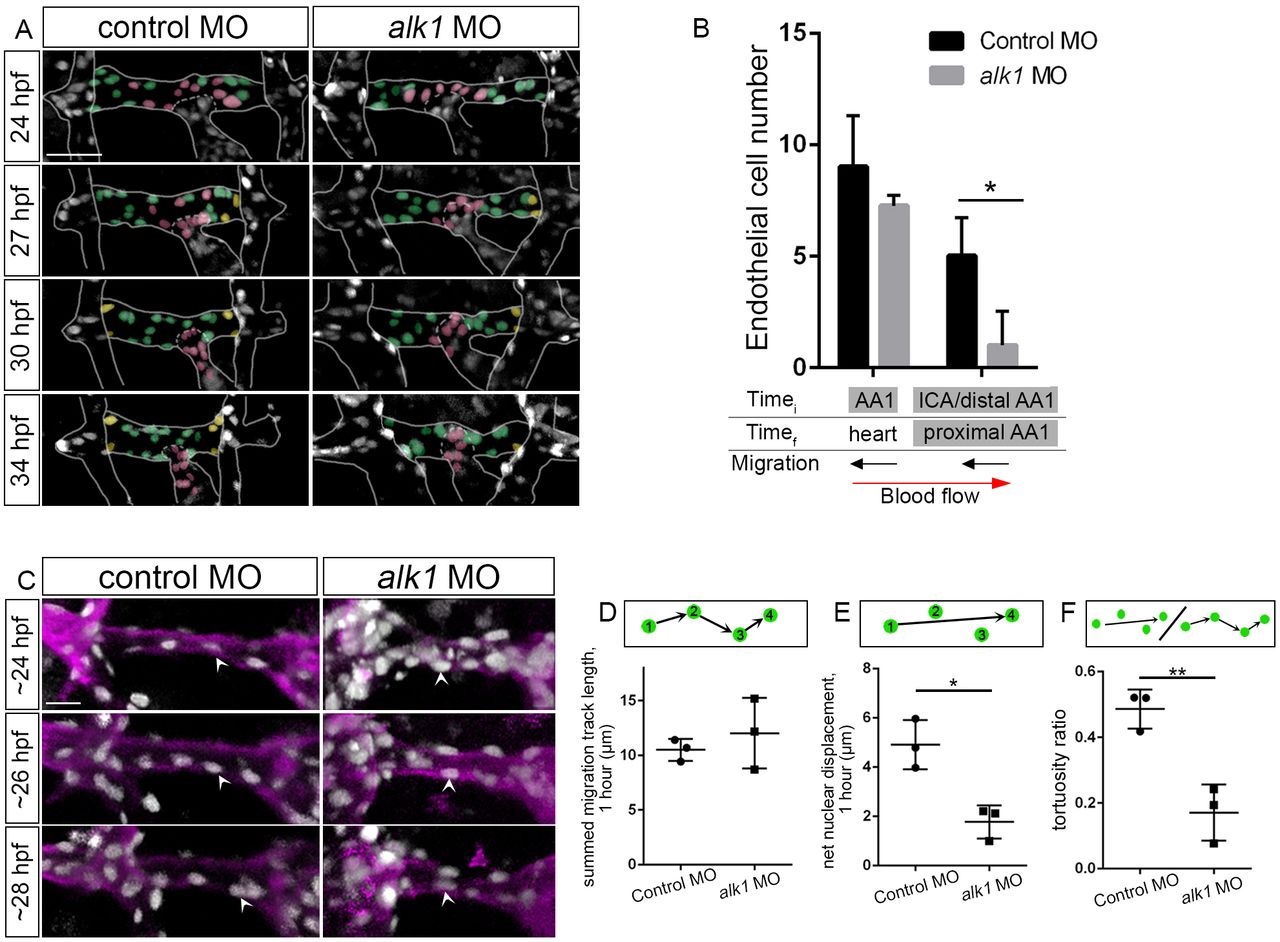
Fig. 5
Endothelial cell migration in the direction of blood flow is enhanced in the CaDI in alk1-deficient embryos. (A) 2D maximum projections of selected time points from two-photon time-lapse imaging of distal cranial blood vessels in control and alk1-morphant Tg(fli1a:nEGFP)y7 embryos, ~24-36hpf. See also Movies 3,4. Vessels of interest are outlined to improve clarity. Selected nuclei are color coded according to their position at the beginning of the time series. Red, cells originate in CaDI; blue, cells originate from PMBC; pink, cells originate from MtA; yellow, cells originate from ICA. Dorsal views, anterior down. Scale bar: 50µm. (B) Quantification of endothelial cells grouped by initial (Timei, 24hpf) and final (Timef, 36hpf) positions. n=4 control, 6 alk1 morphants. Below the graph, names of alk1-positive vessels are shaded gray, and direction of cell migration with respect to blood flow is depicted by black arrows. Graphs represent mean±s.e.m. Two-tailed Student′s t-test, *P<0.05.