
|
Fig. S8
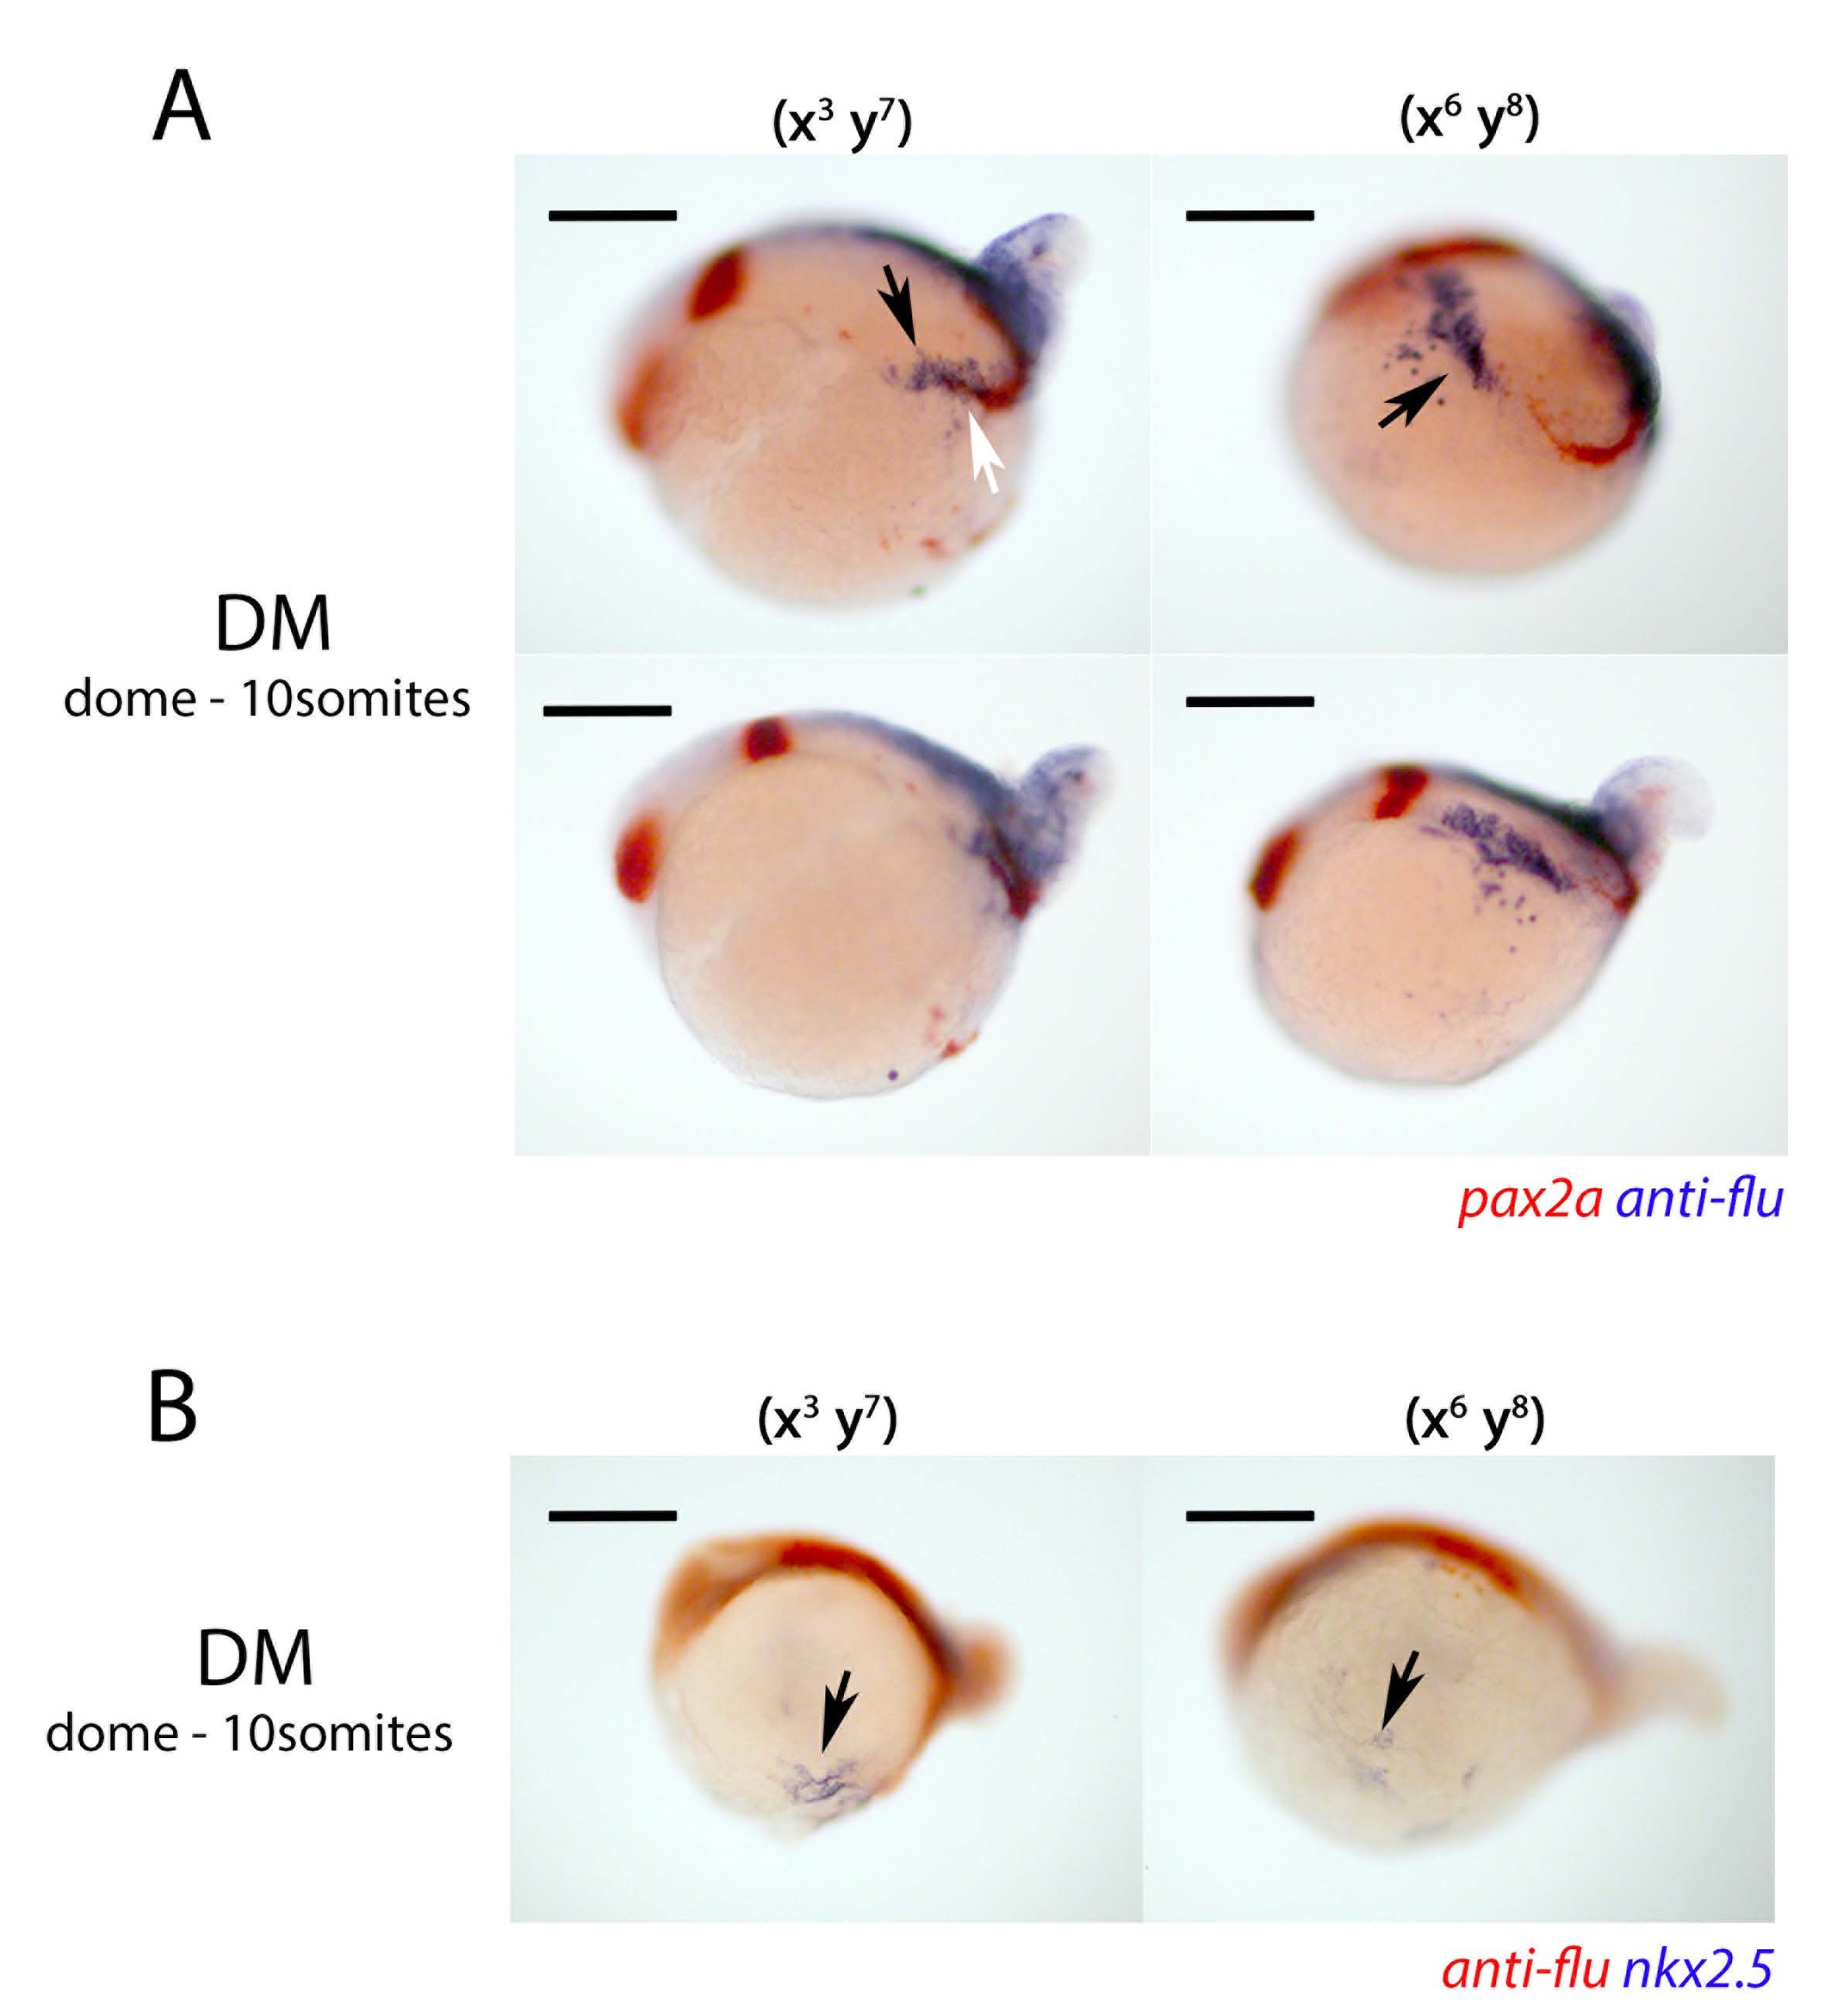
Oblique and lateral views of DM treated embryos lineage labeled at 85% epiboly at positions (x3 , y7) and (x6, y8).
A) The same OM treated embryos shown in Figure 8B are shown here, with the top panels being oblique views and the bottom panels being lateral views. In the (x3 , y7) labeled embryos the lineage tracer can be detected within the anterior-most region of the pronephric pax2a+ domain (white arrow) as well as in a medial domain we presume to be paraxial mesoderm (black arrow). In the (x6 , y8) labeled embryos, oblique views highlight the more anterior region of tissue (black arrow), which we predict is anterior paraxial mesoderm, that has been traced in these OM treated embryos. B) The same OM treated embryos shown in Figure 8e are shown here, but in lateral views where nkx2.5+ heart progenitors can be better observed (black arrows). Scale bar represents 100 µm