
Image
|
Figure Caption
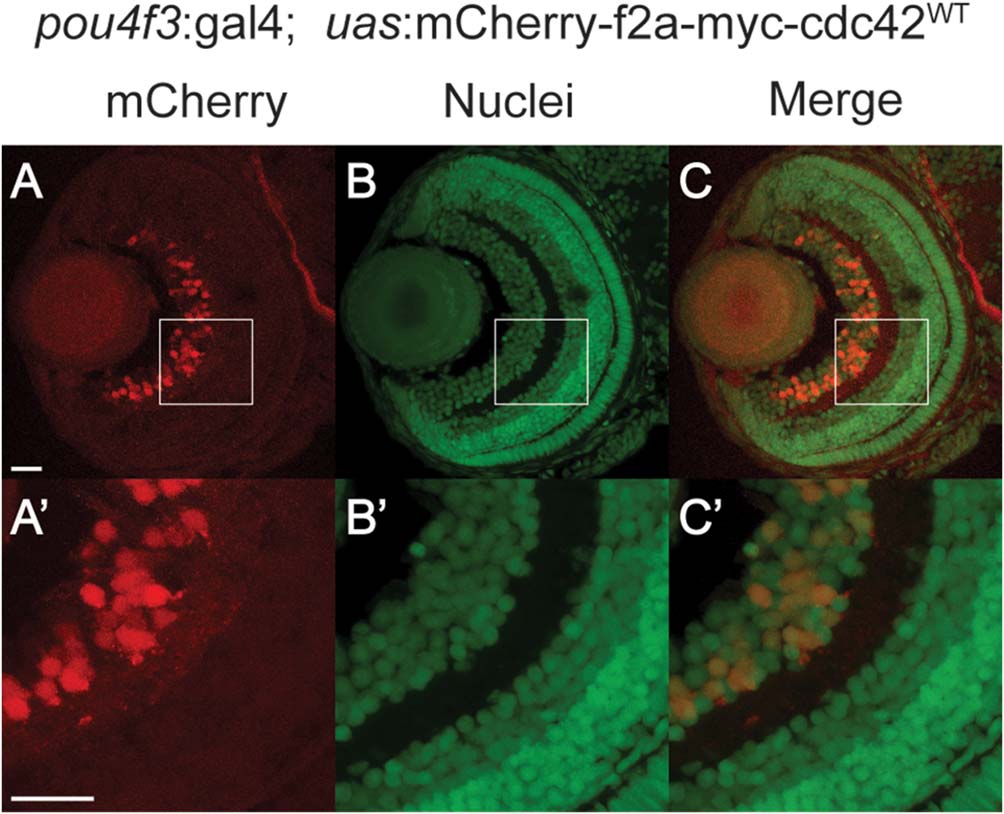
Fig. 3
Tissue-specific control of transgene expression. Driven by pou4f3:gal4, mCherry (A,A′) is specifically expressed in the RGC layer (B,B′) of 4dpf pou4f3:gal4;uas:mCherry-f2a-Cdc42WT embryos. A′-C′ are magnified images taken from the boxed regions in A-C. Scale bars = 20 µm.
Acknowledgments
This image is the copyrighted work of the attributed author or publisher, and
ZFIN has permission only to display this image to its users.
Additional permissions should be obtained from the applicable author or publisher of the image.
Full text @ Dev. Dyn.